Basic Candles
Candlesticks are going to be your primary method of reading a shares price history over a time period. Below you'll find the most common examples used in most trading platforms.
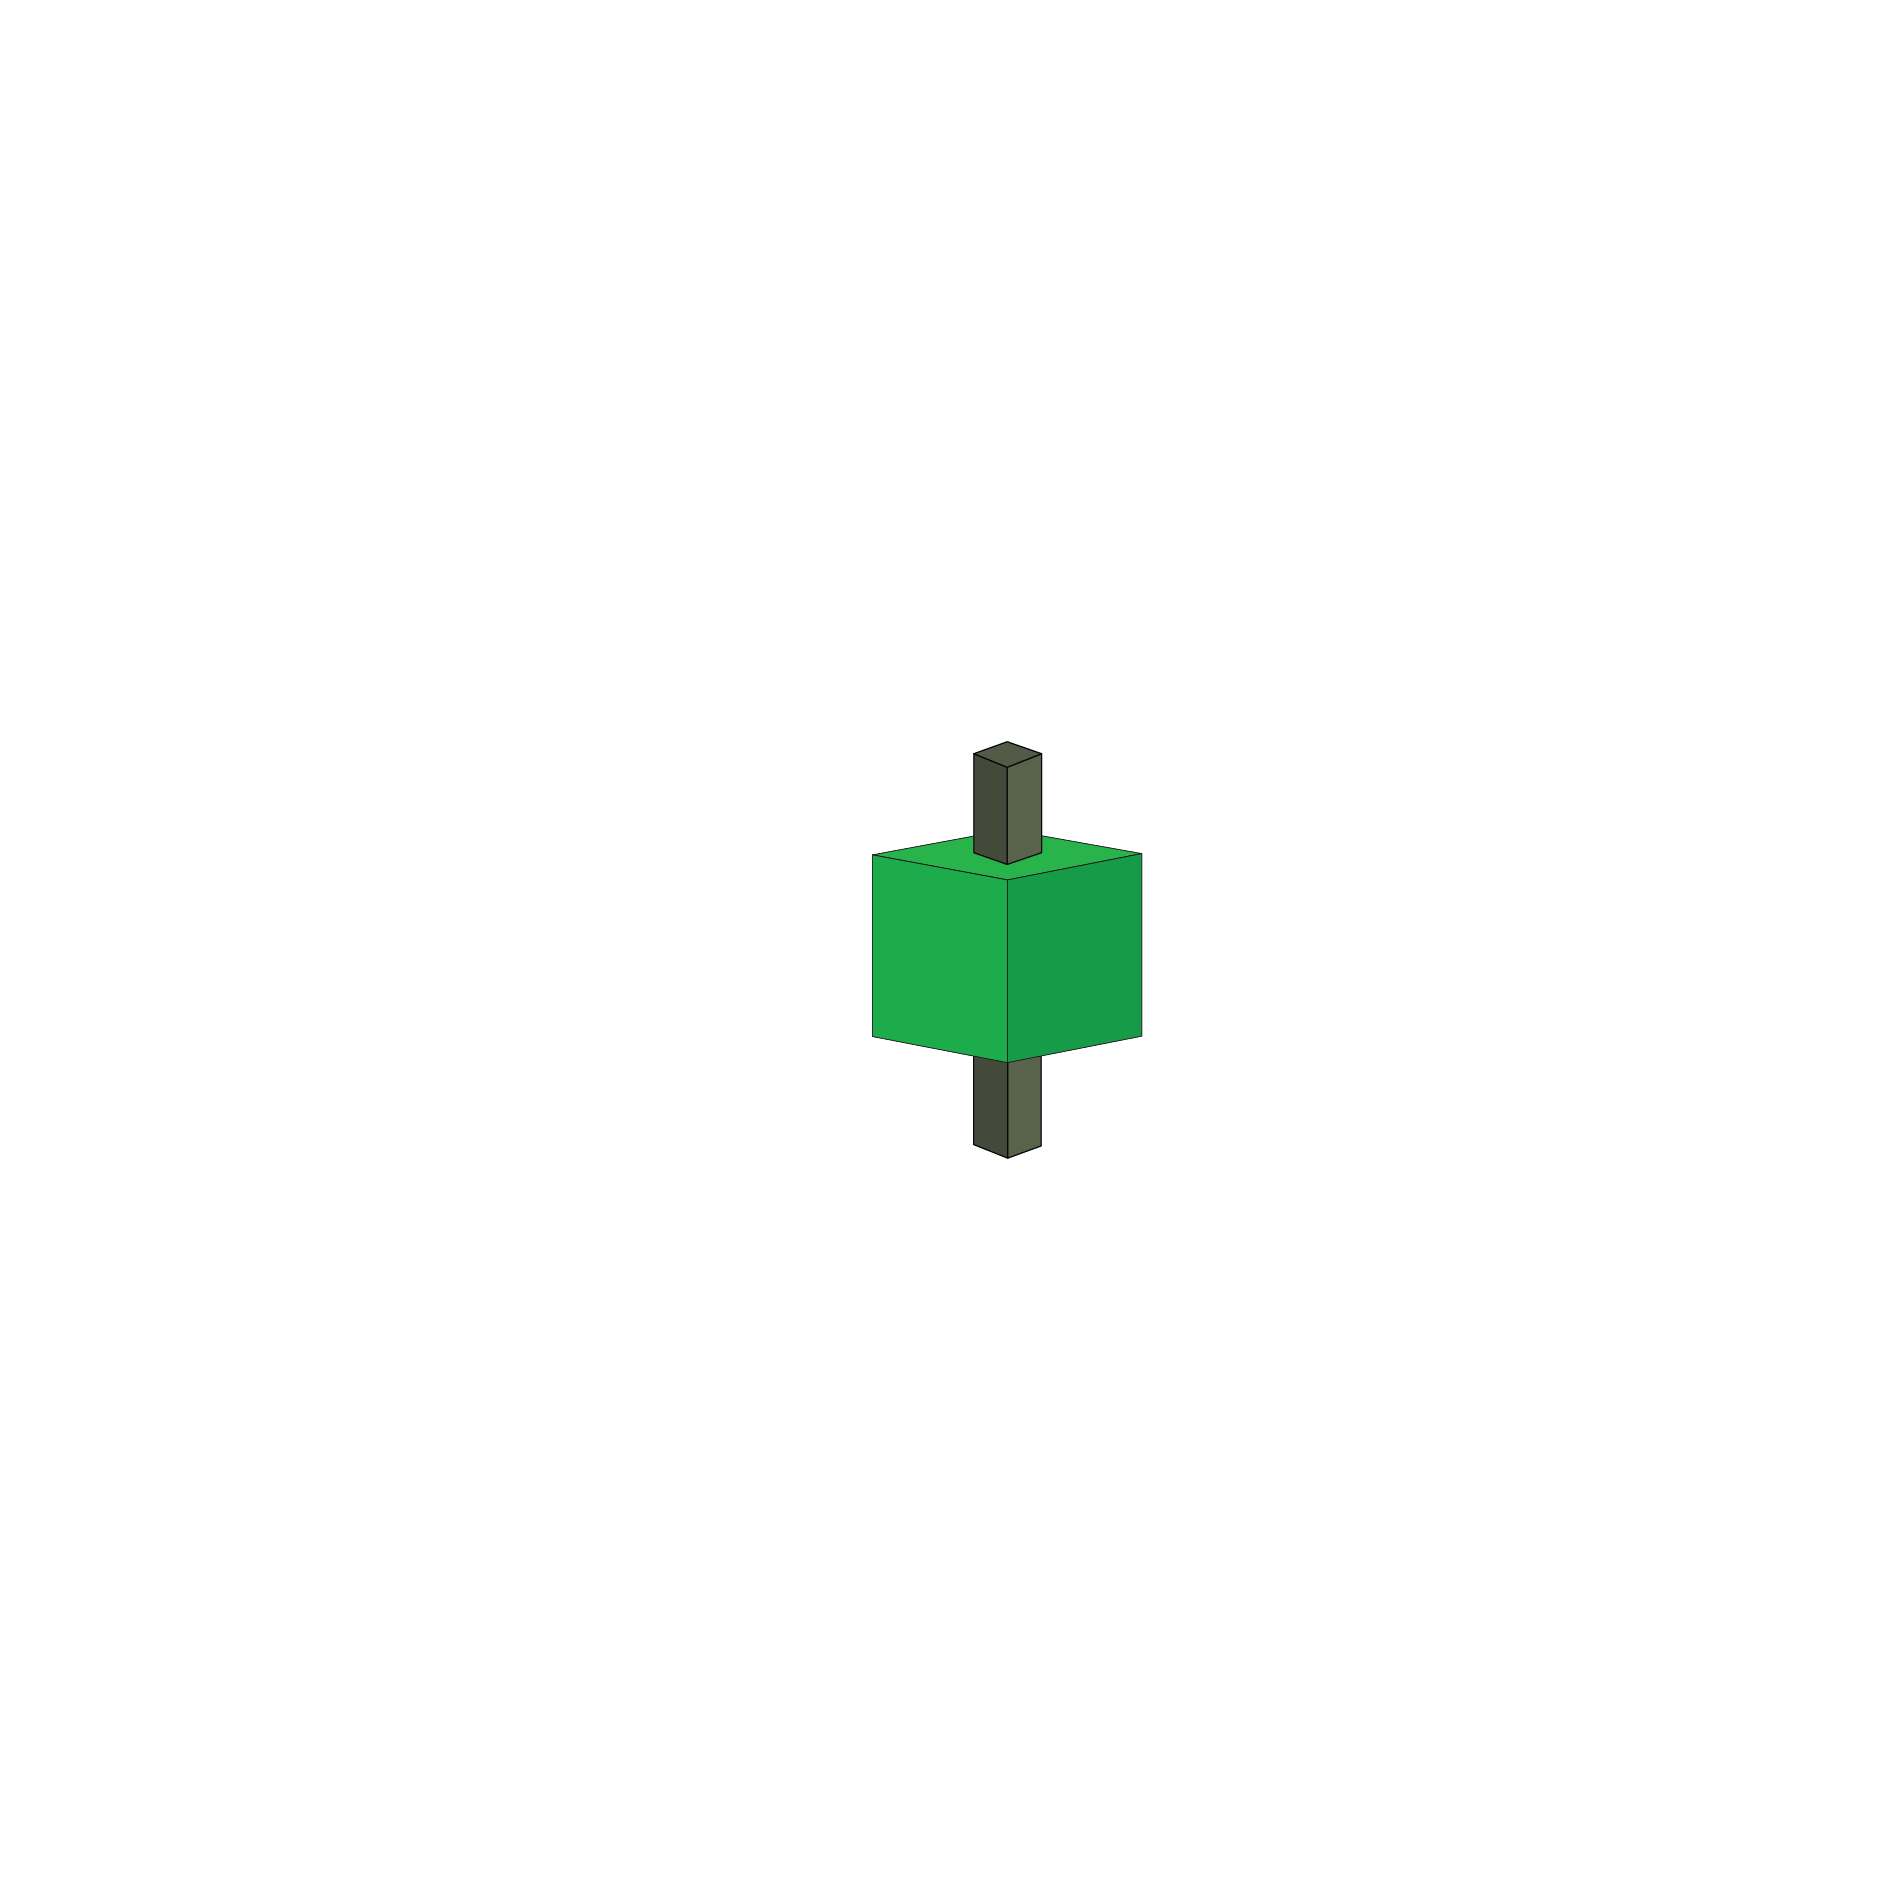
Short Green Candlestick
This candlstick implies a relatively weak buying pressure with a limited price movement.
Short Red Candlestick
This candlestick implies a relatively weak selling pressure with a limited price movement.

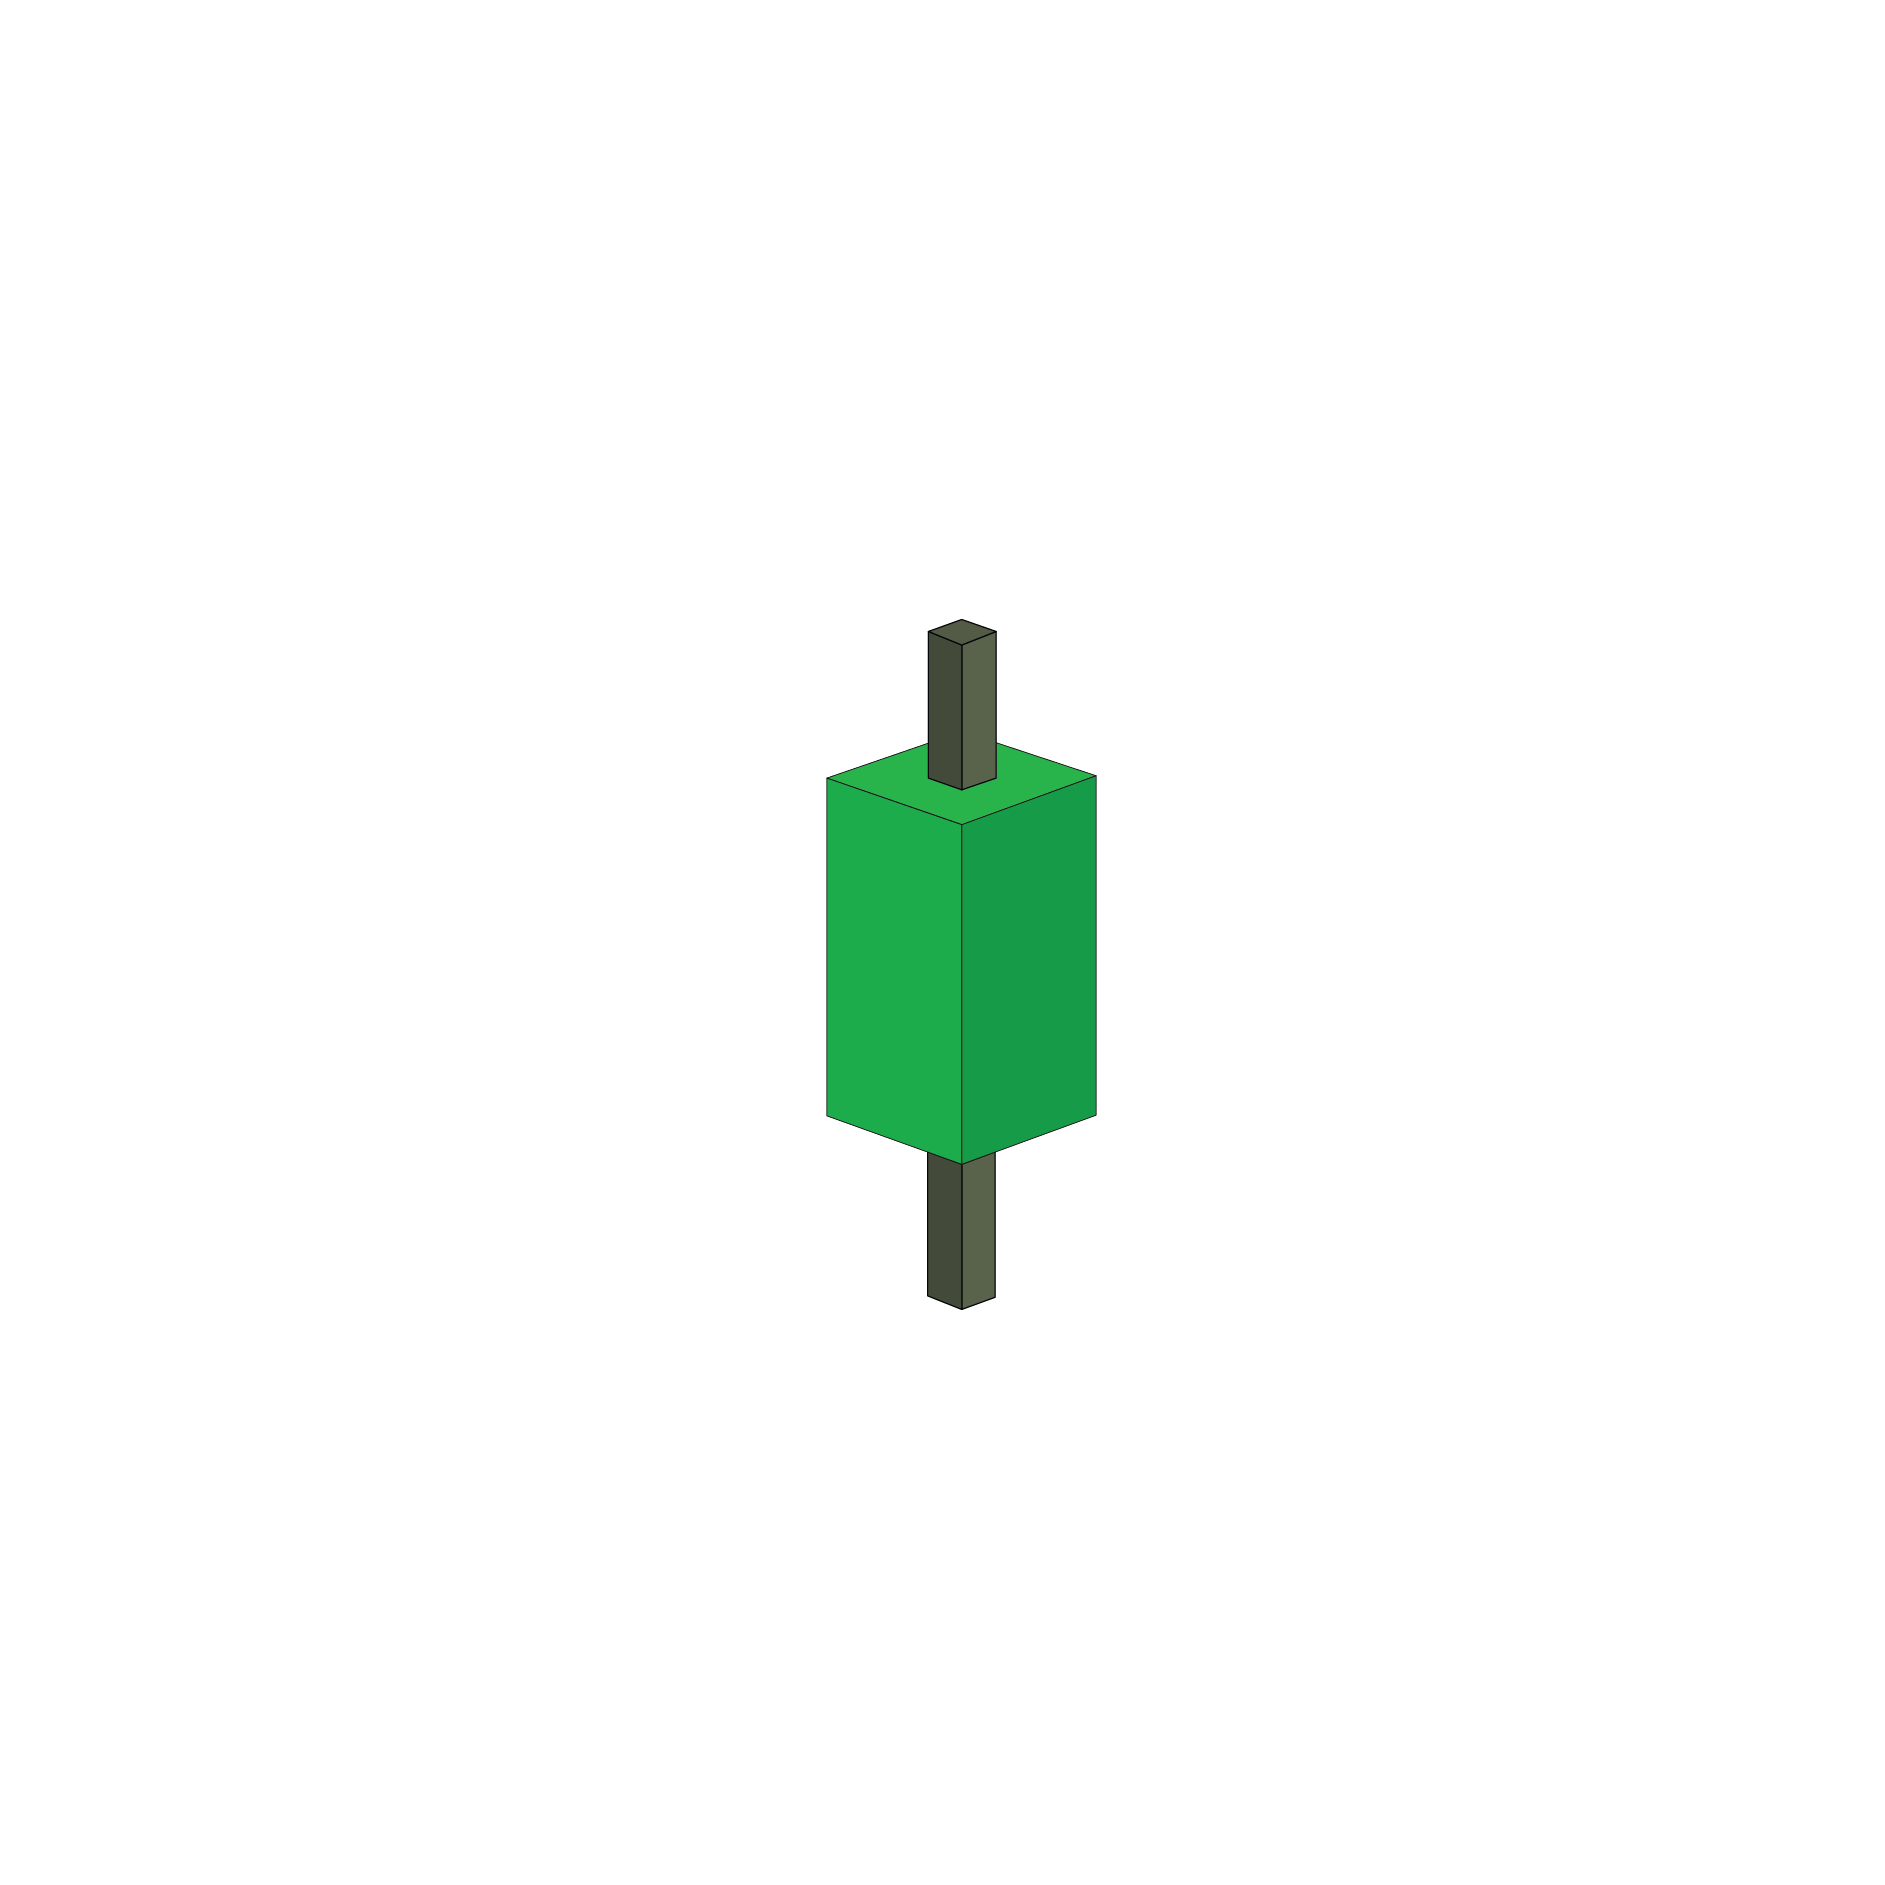
Green Candlestick
This candlestick implies normal buying pressure, and shows that prices advanced during the day from open to close and the buyers were in control.
Red Candlestick
This candlestick implies normal selling pressure, and shows that prices declined during the day from open to close and the sellers were in control.
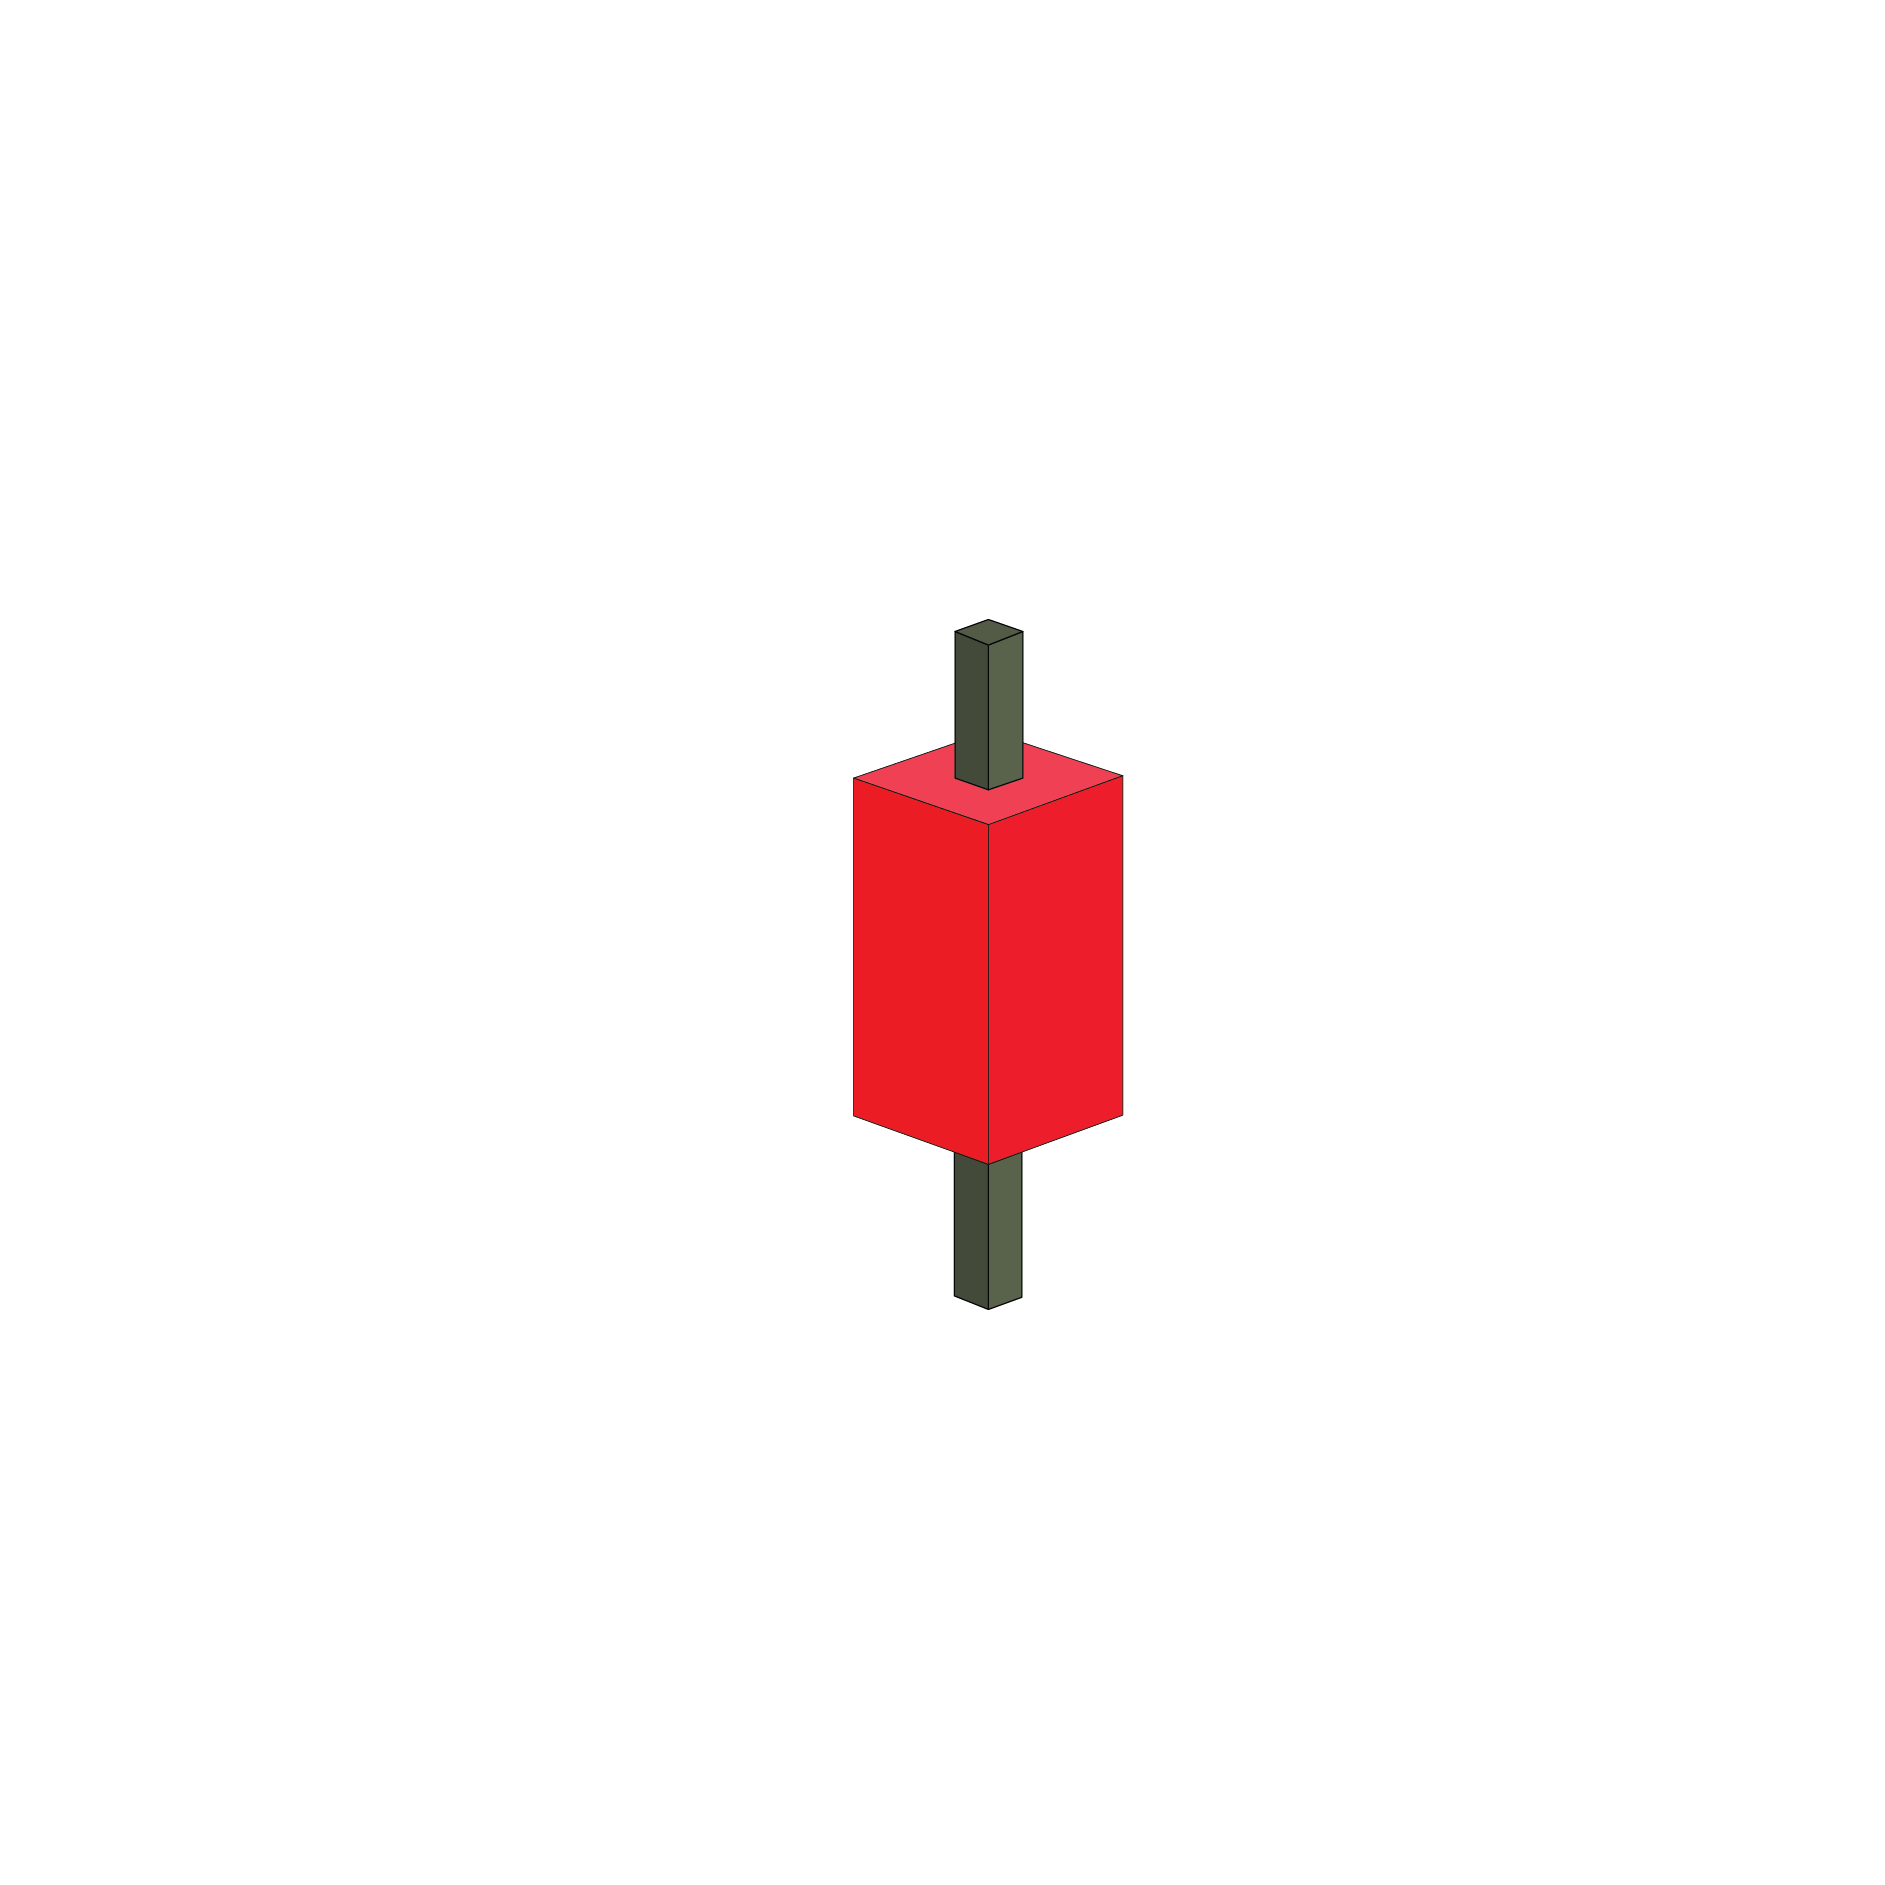
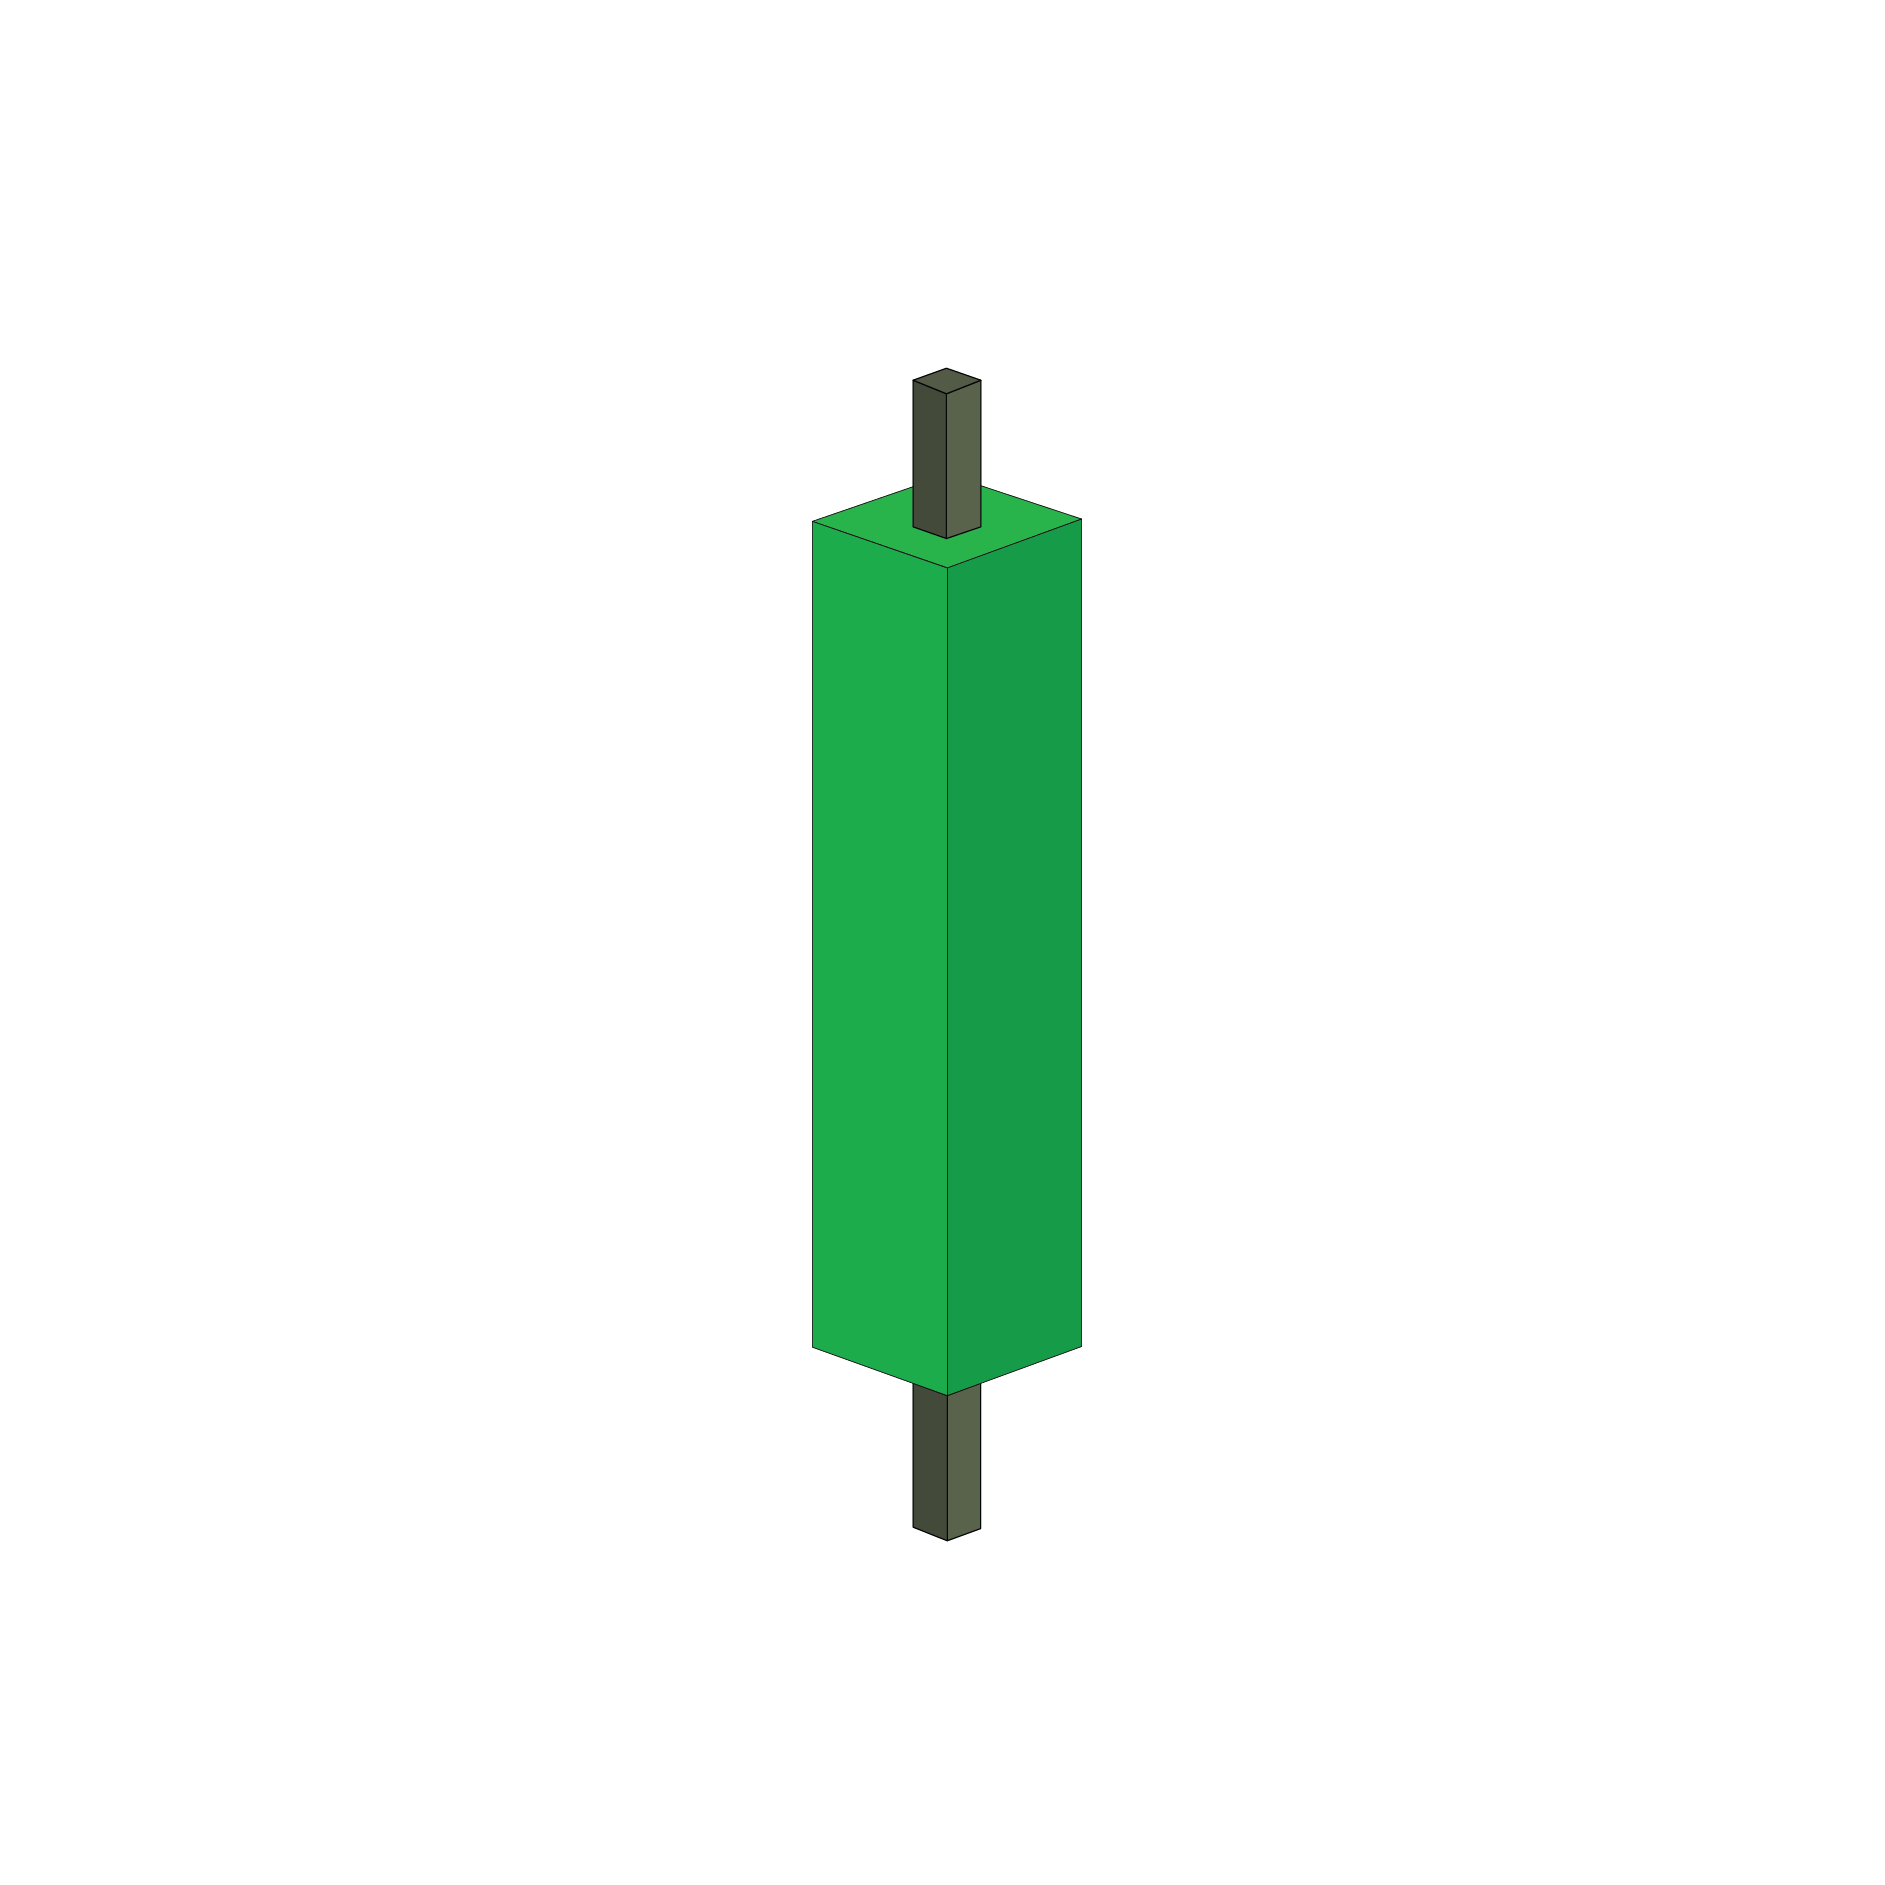
Long Green Candlestick
This candlestick implies normal buying pressure, and shows that prices advanced during the day from open to close and the buyers were in control.
Long Red Candlestick
This candlestick implies relatively strong selling pressure, and shows that prices declined during the day significantly from open to close and the sellers were aggressive.
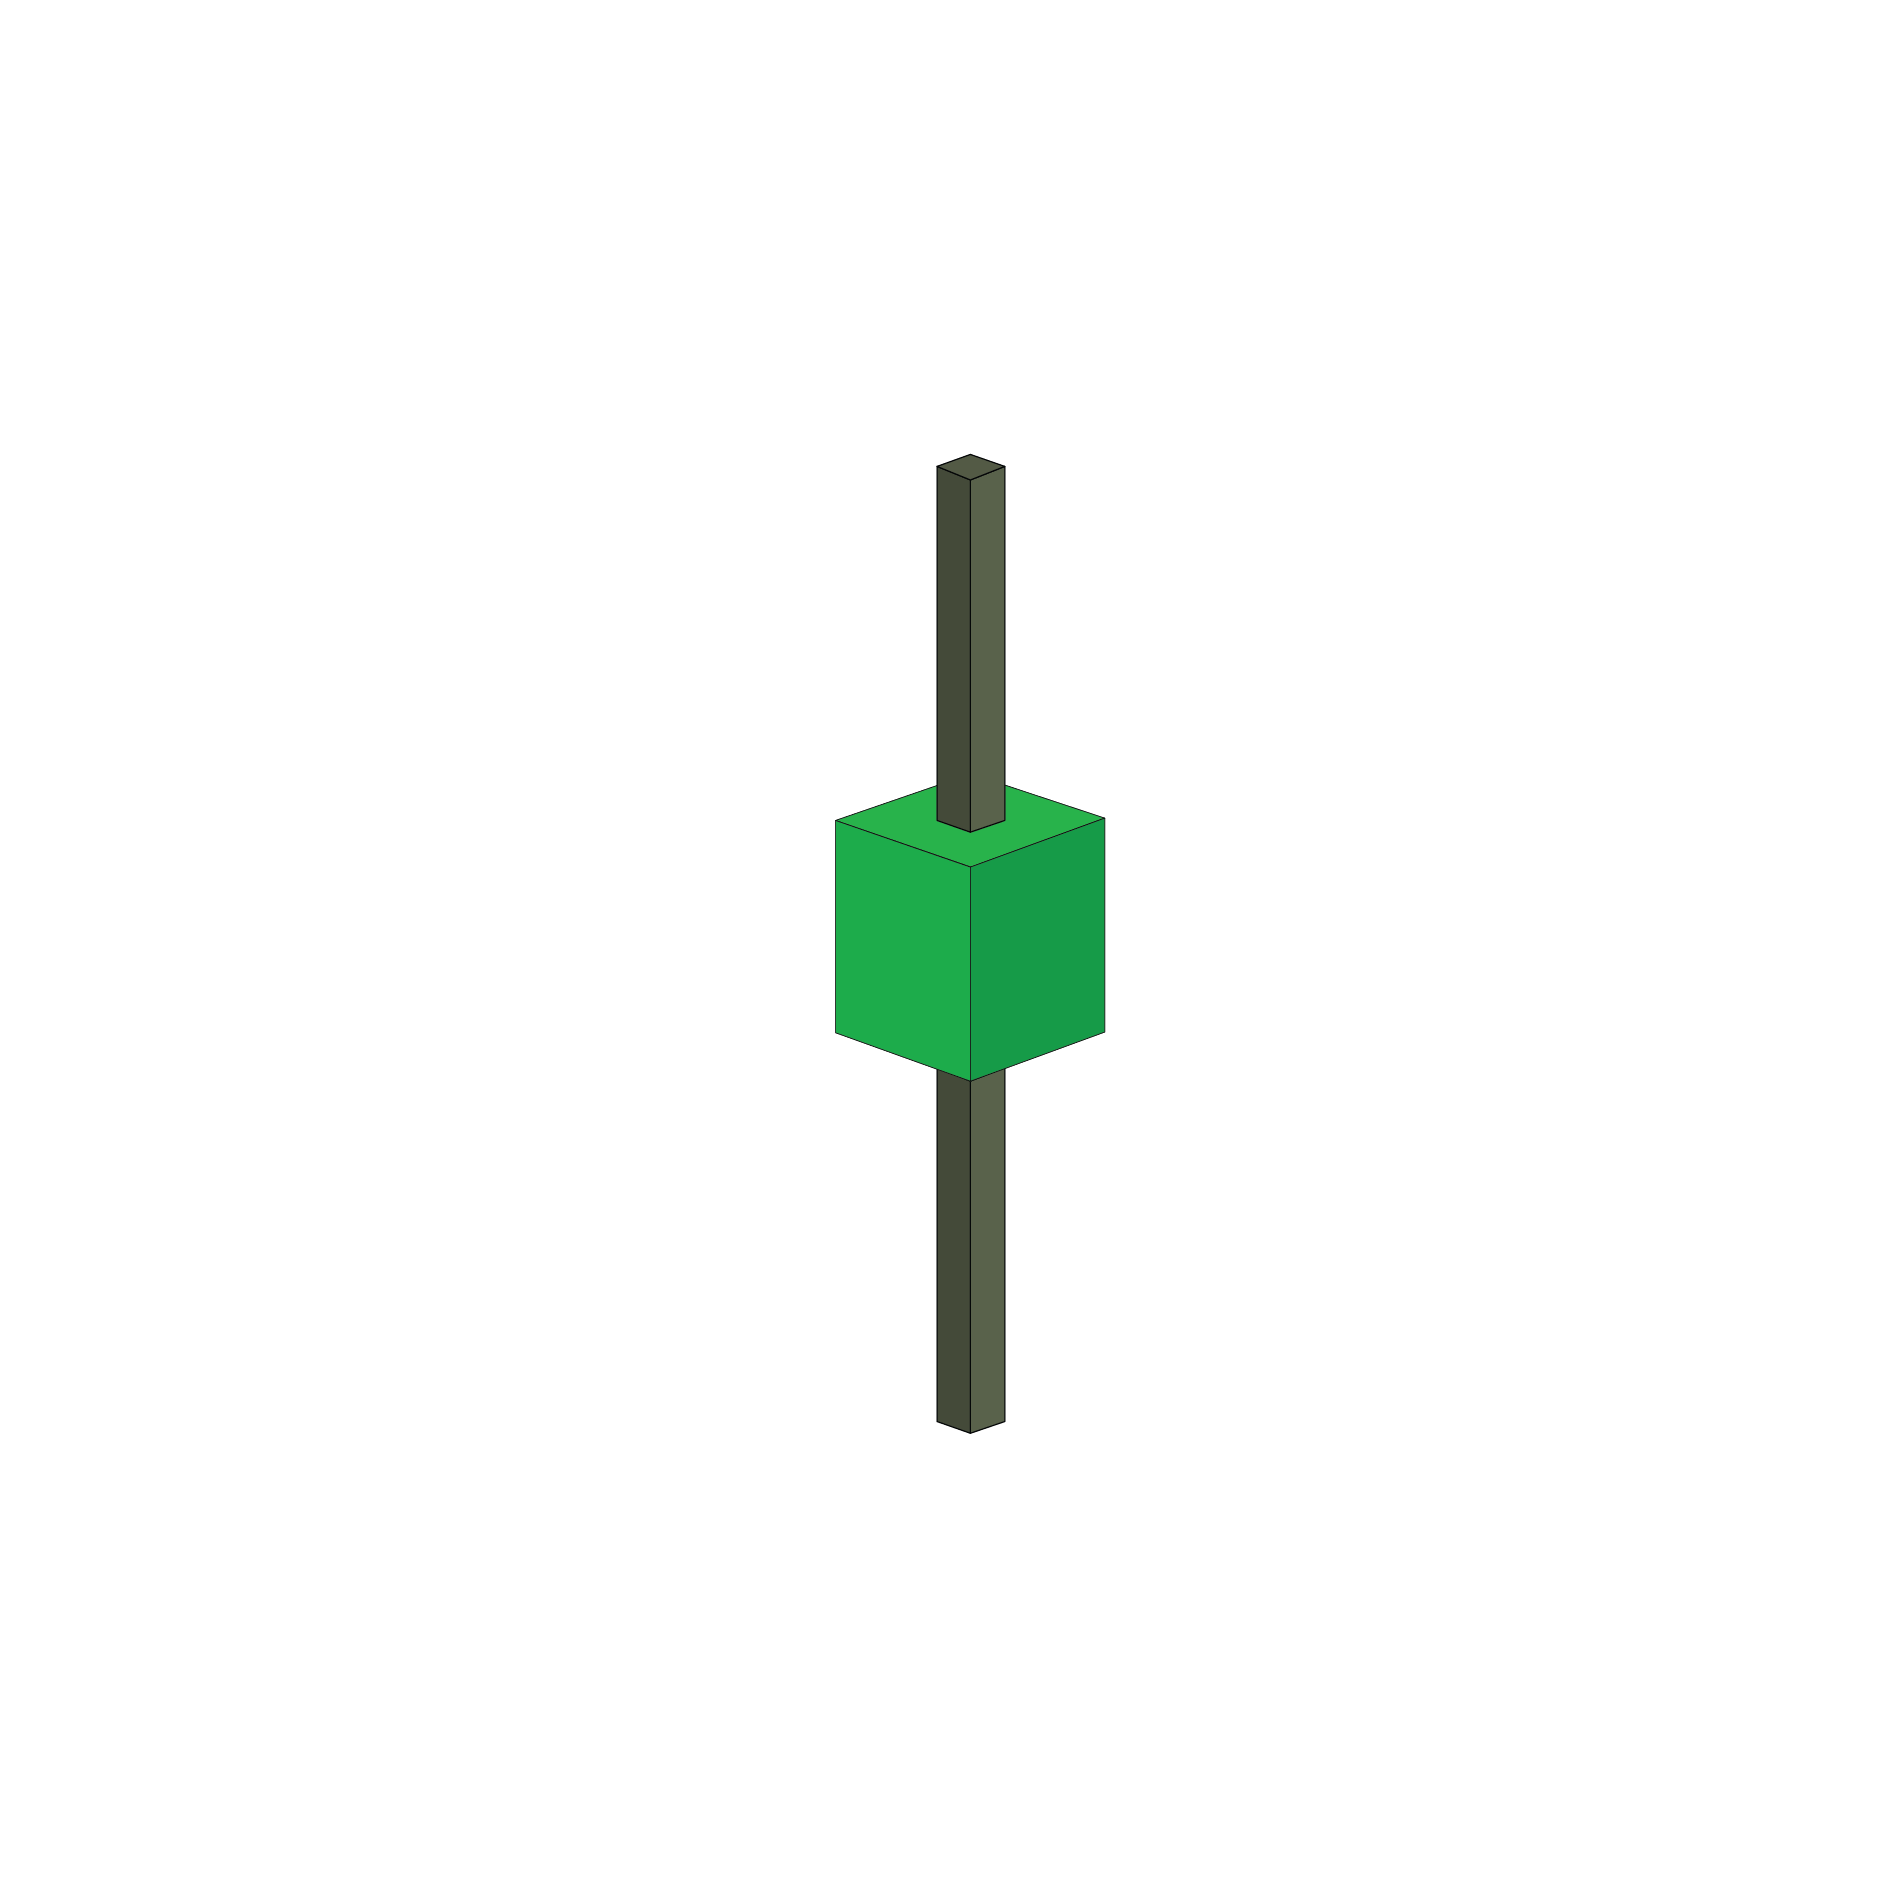
Green Spinning Top
This candlestick has a tiny green body with upper and lower shadows that have a greater length than the body. It is accepted as a type of Doji.
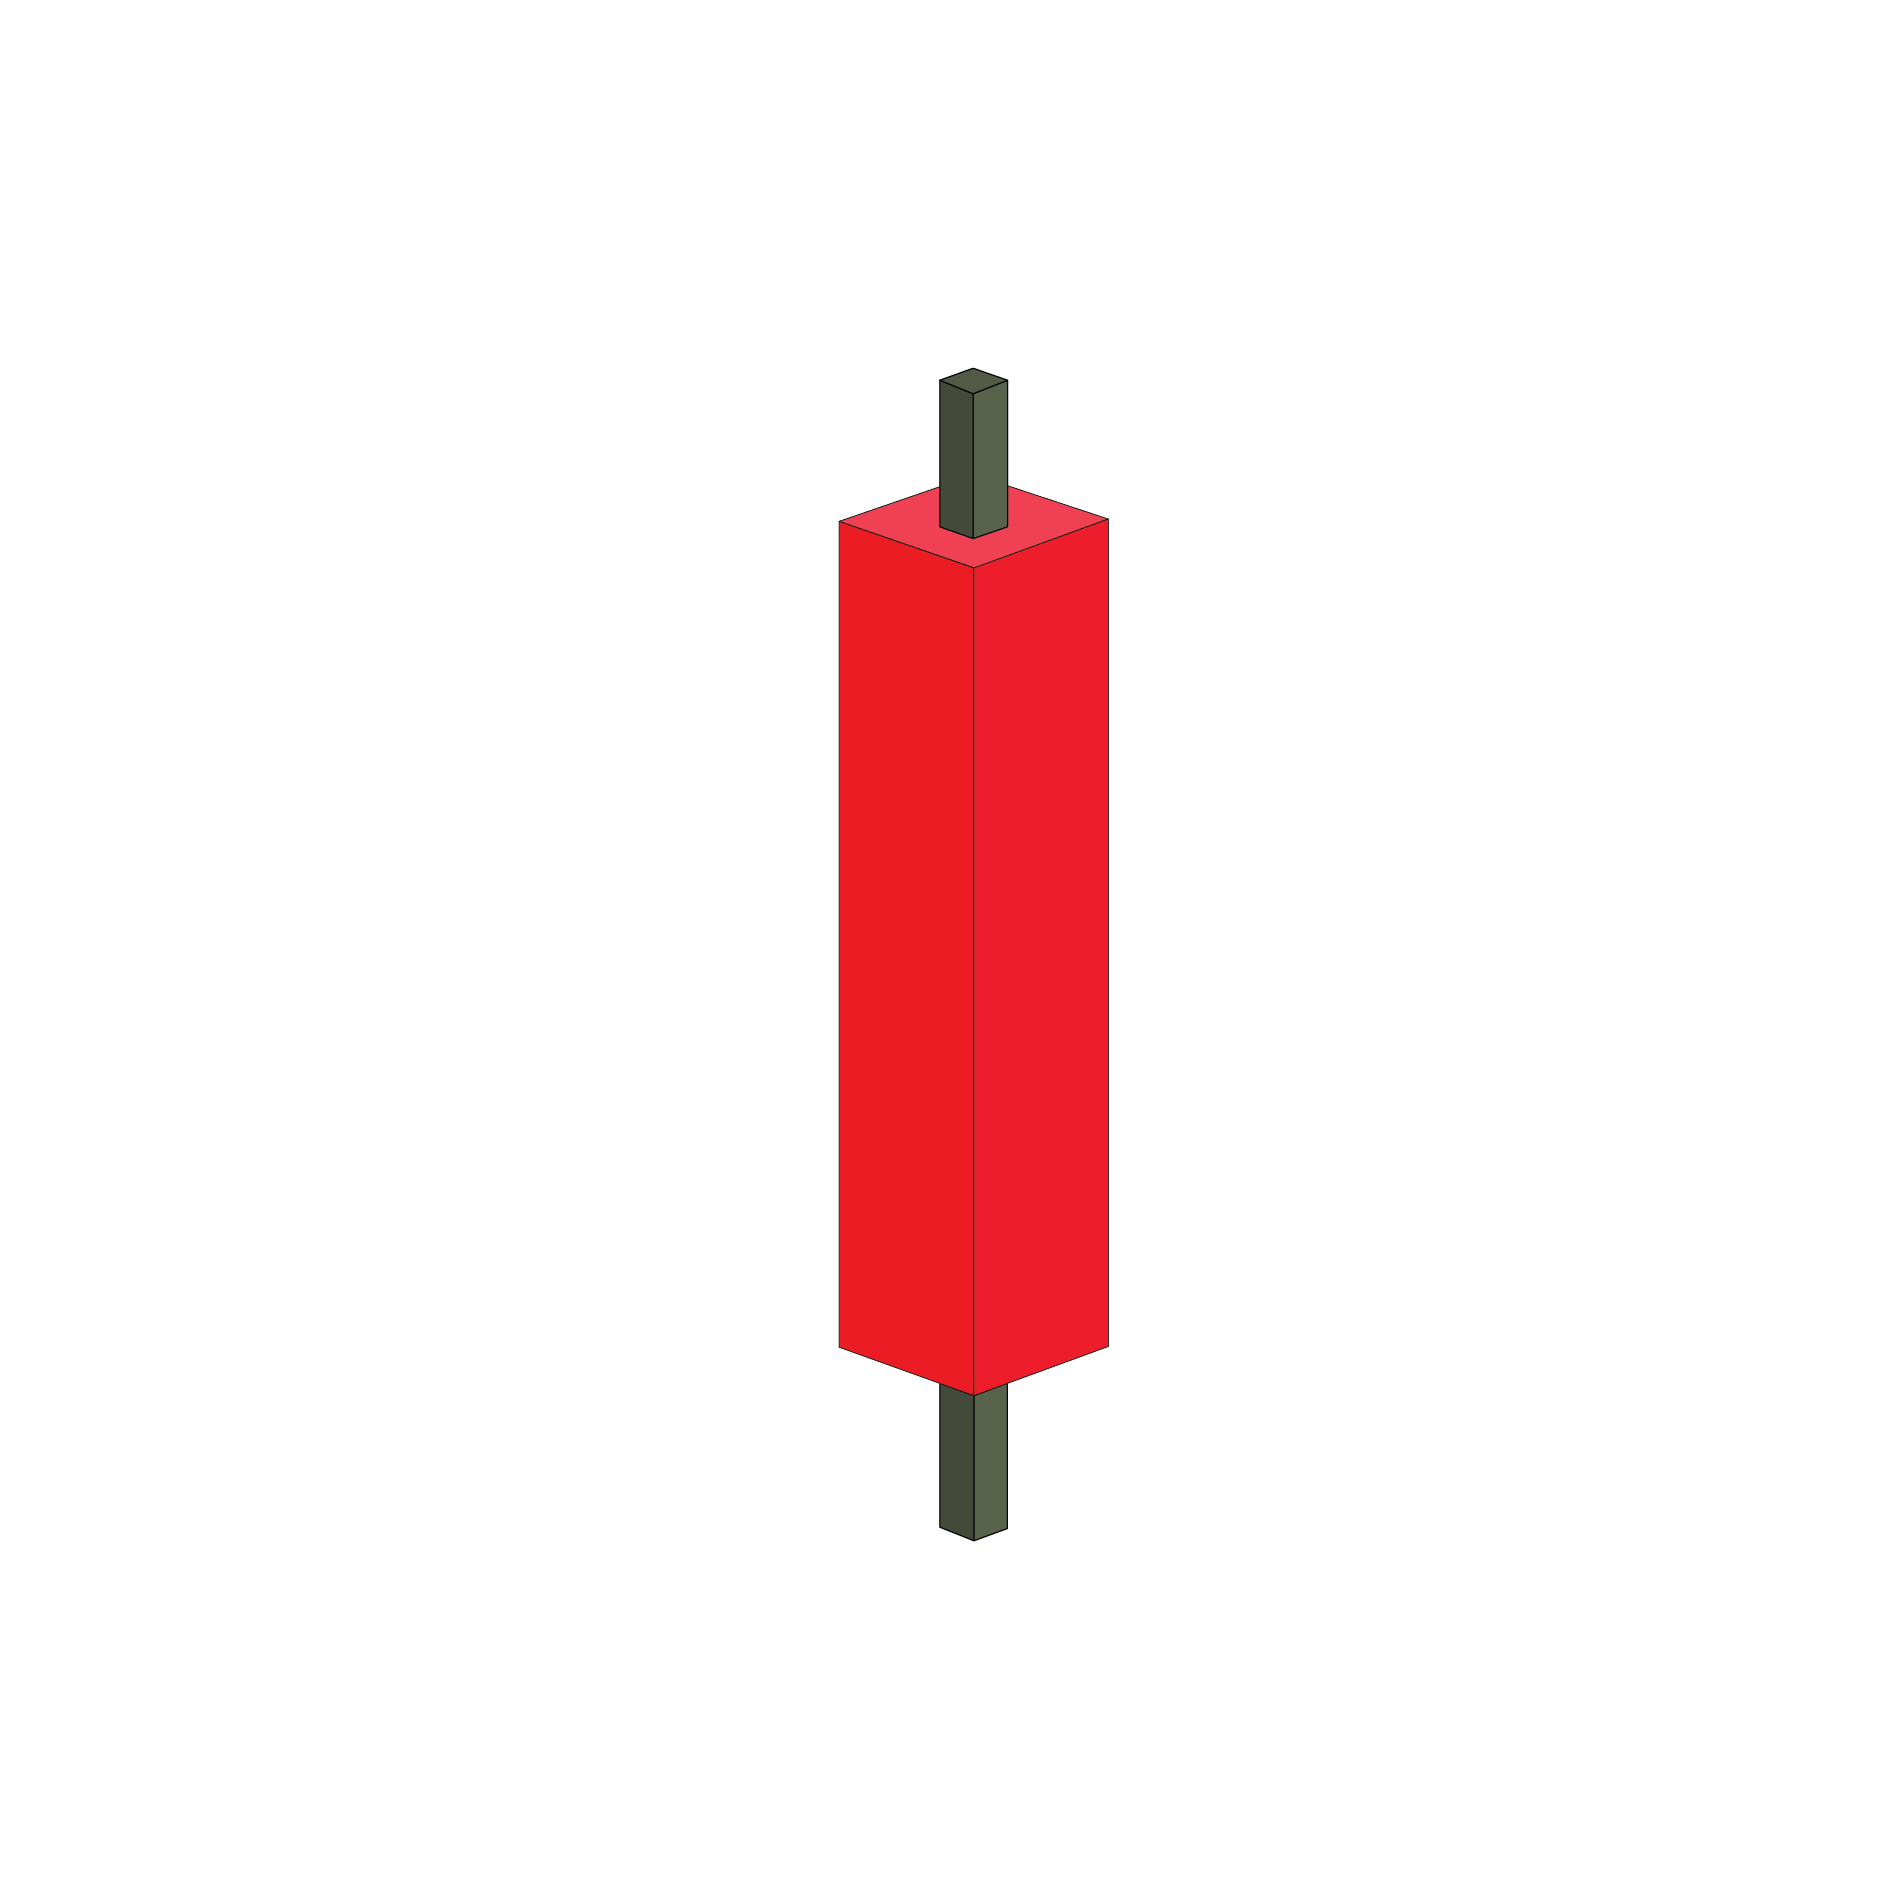
Red Spinning Top
This candlestick has a tiny red body with upper and lower shadows that have a greater length than the body. It too is accepted as a type of Doji.
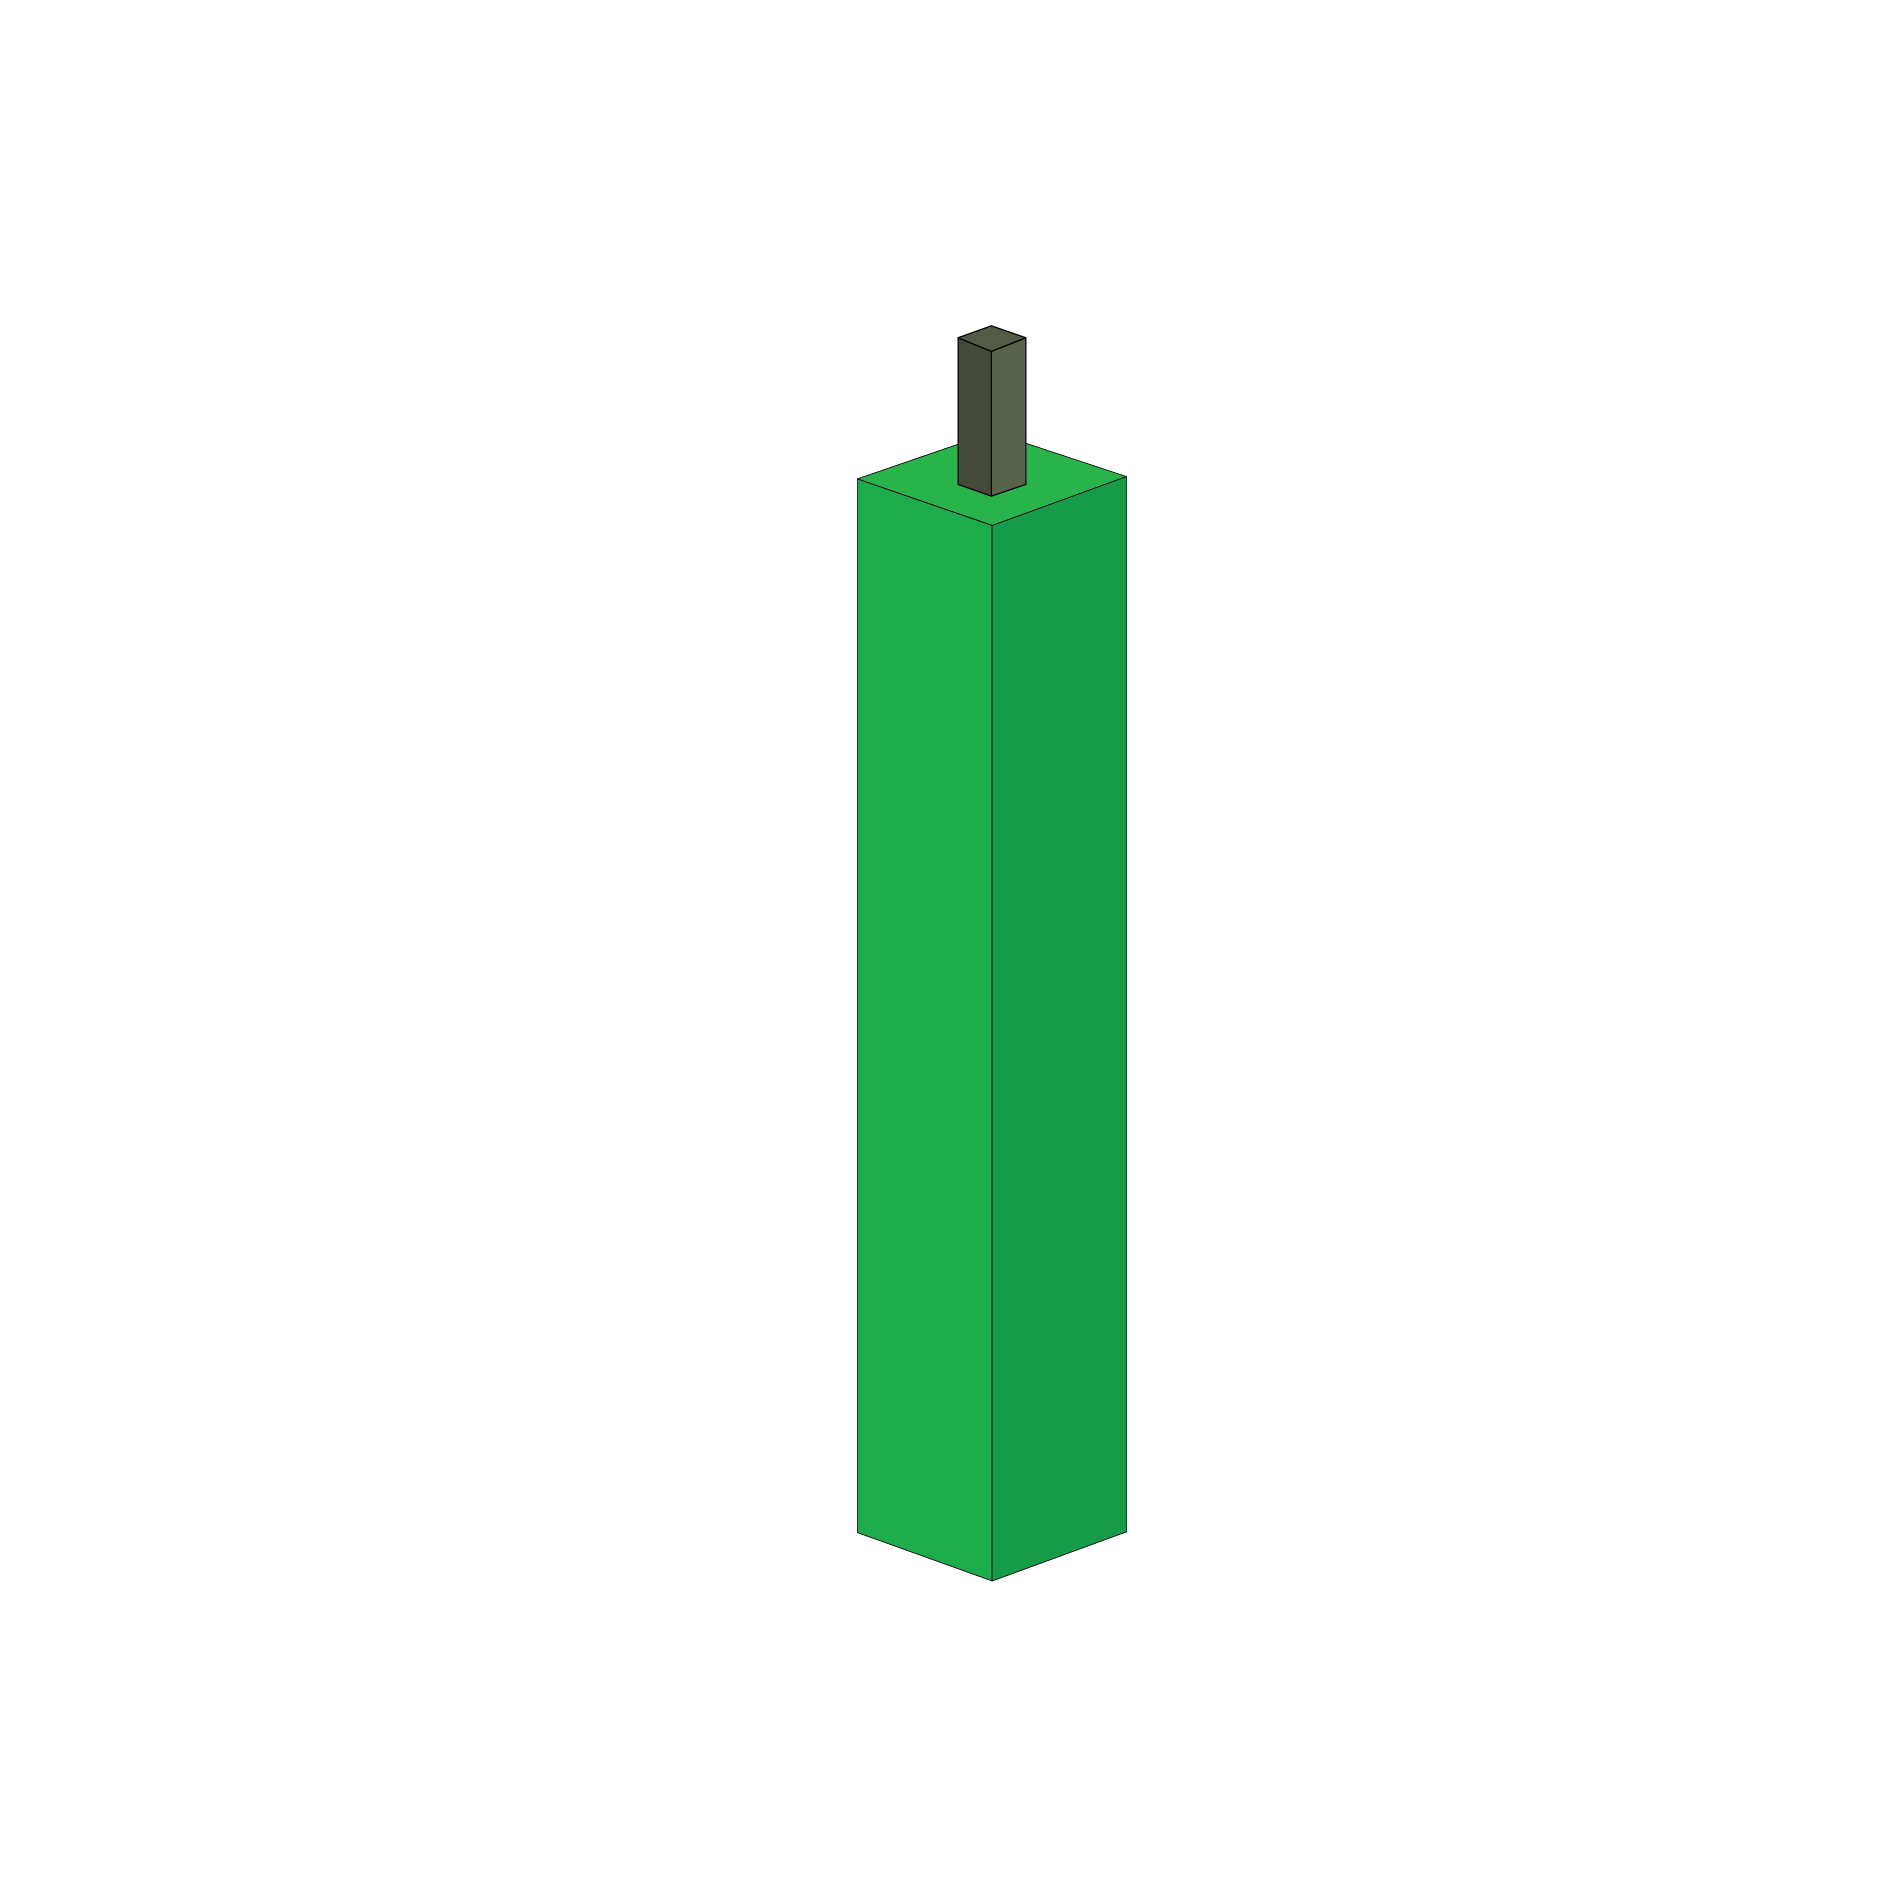
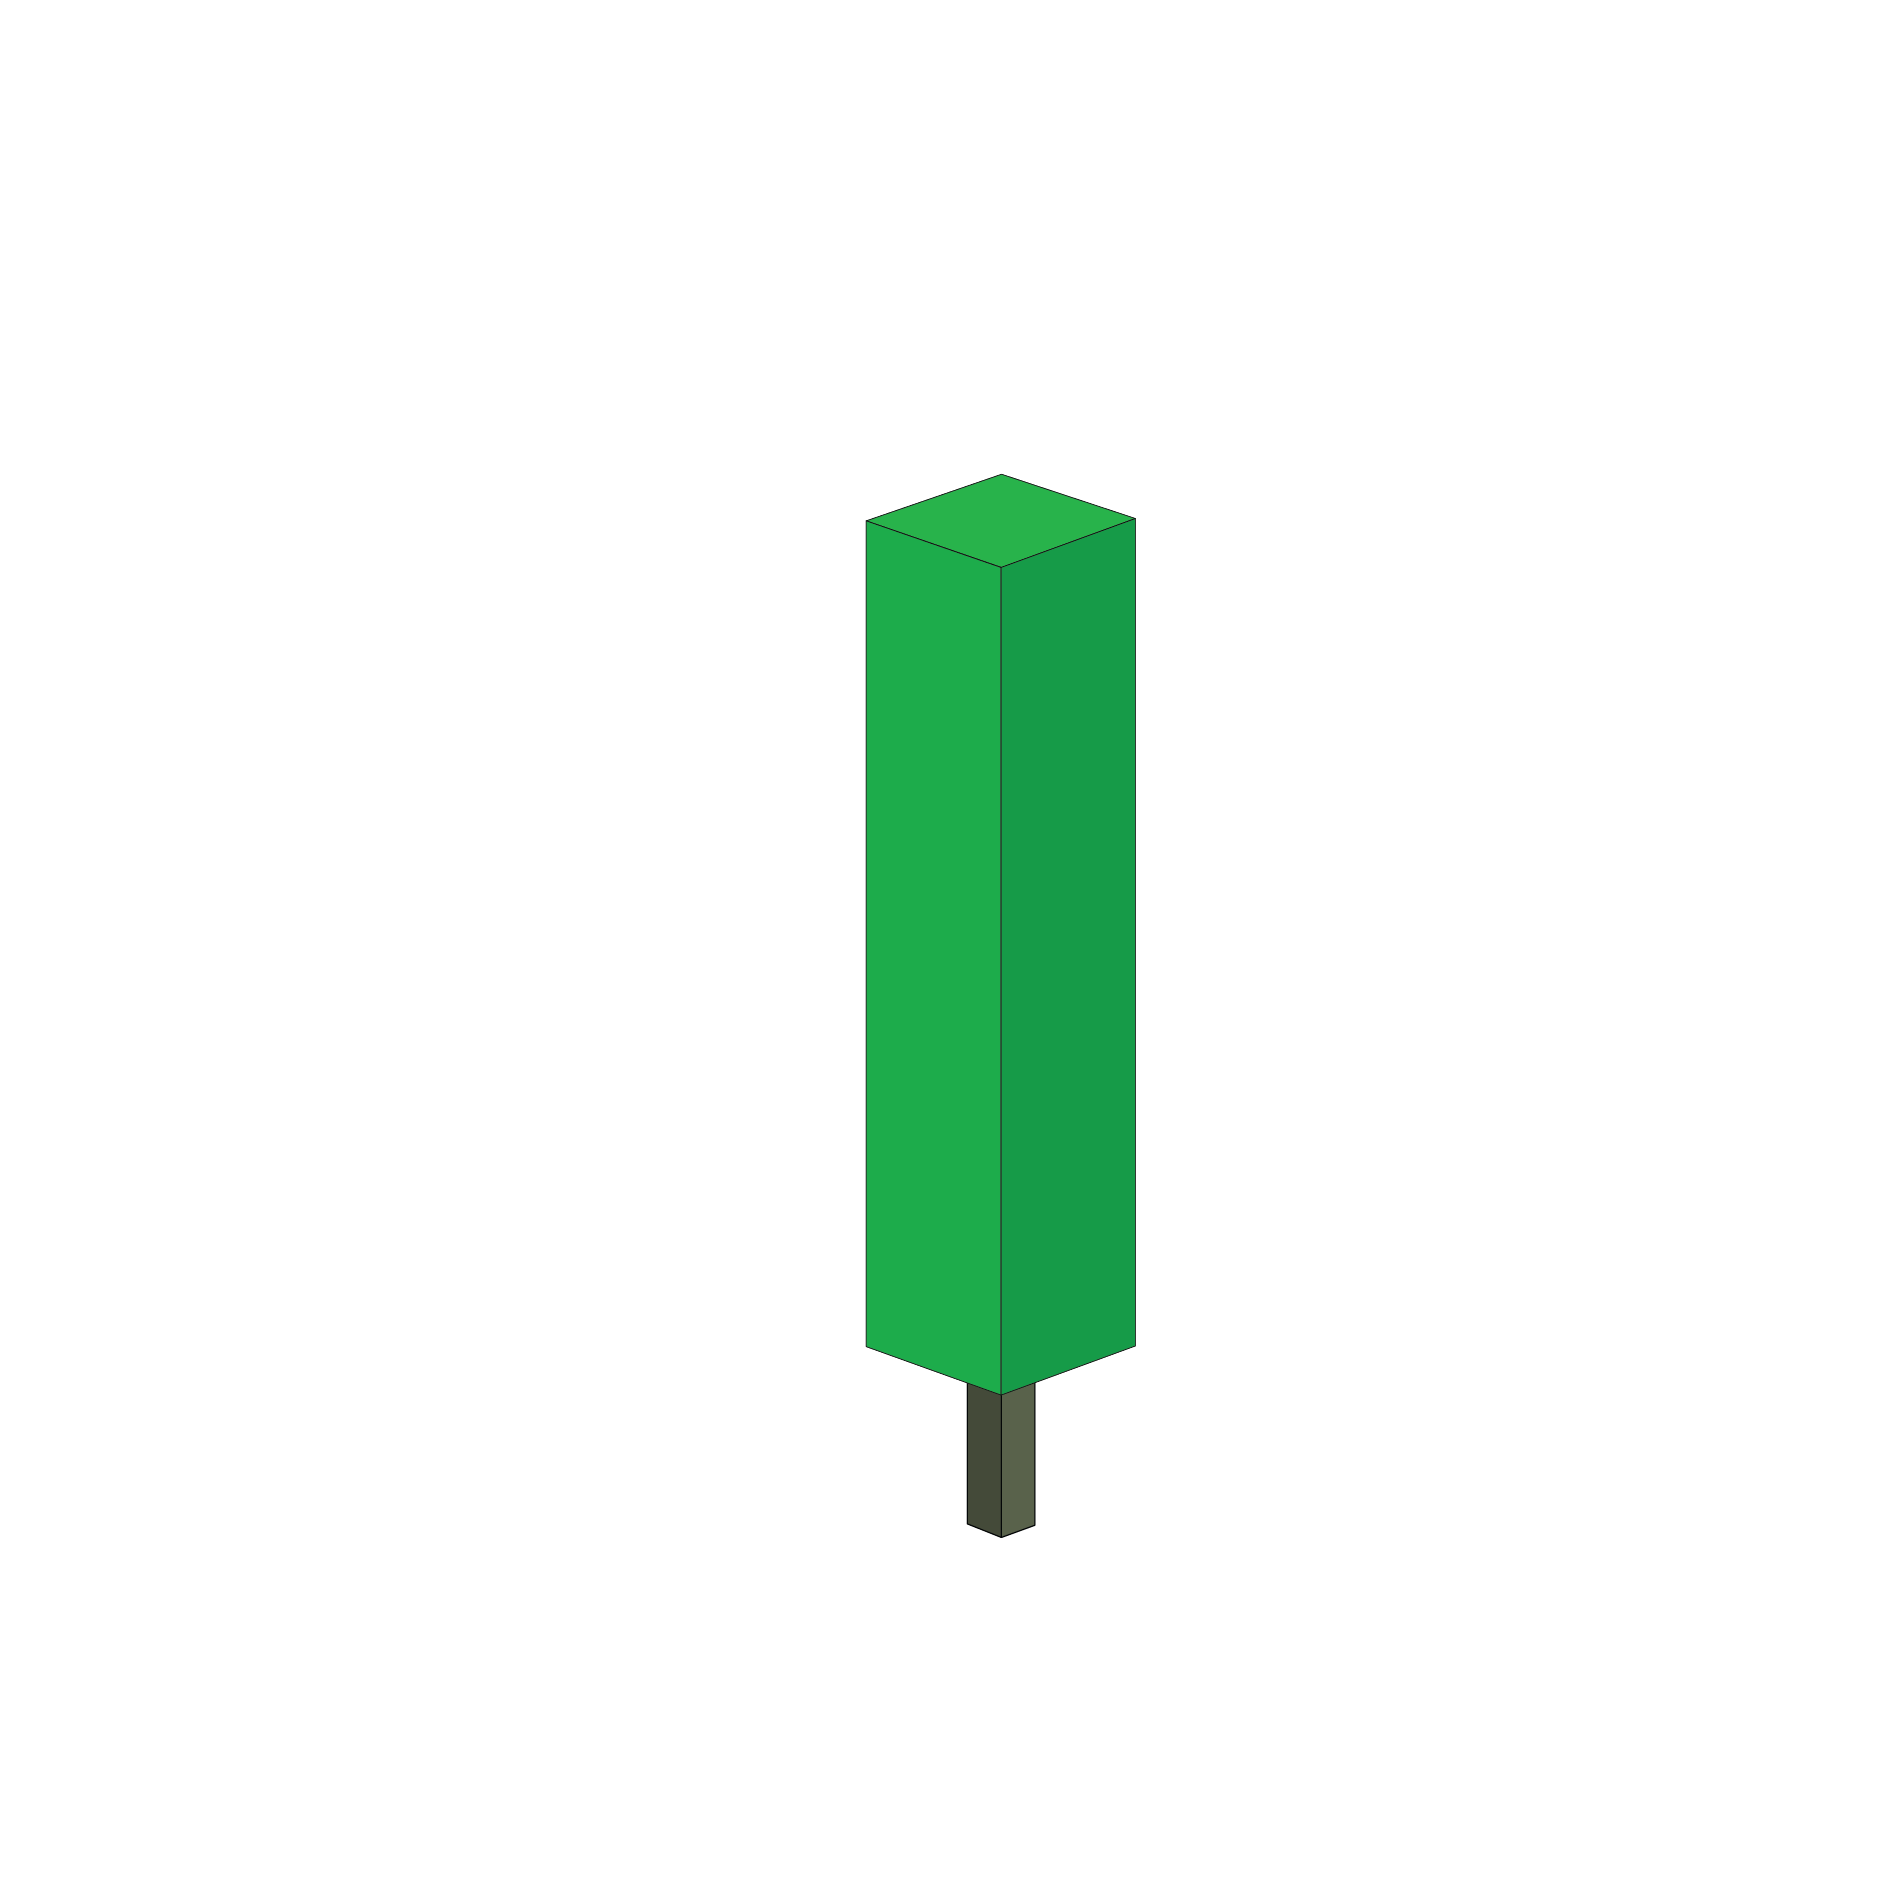
Green Opening Marubozu
This candlestick represents extreme bullishness and it is characterized with a long green body that has an upper shadow but no lower shadow.
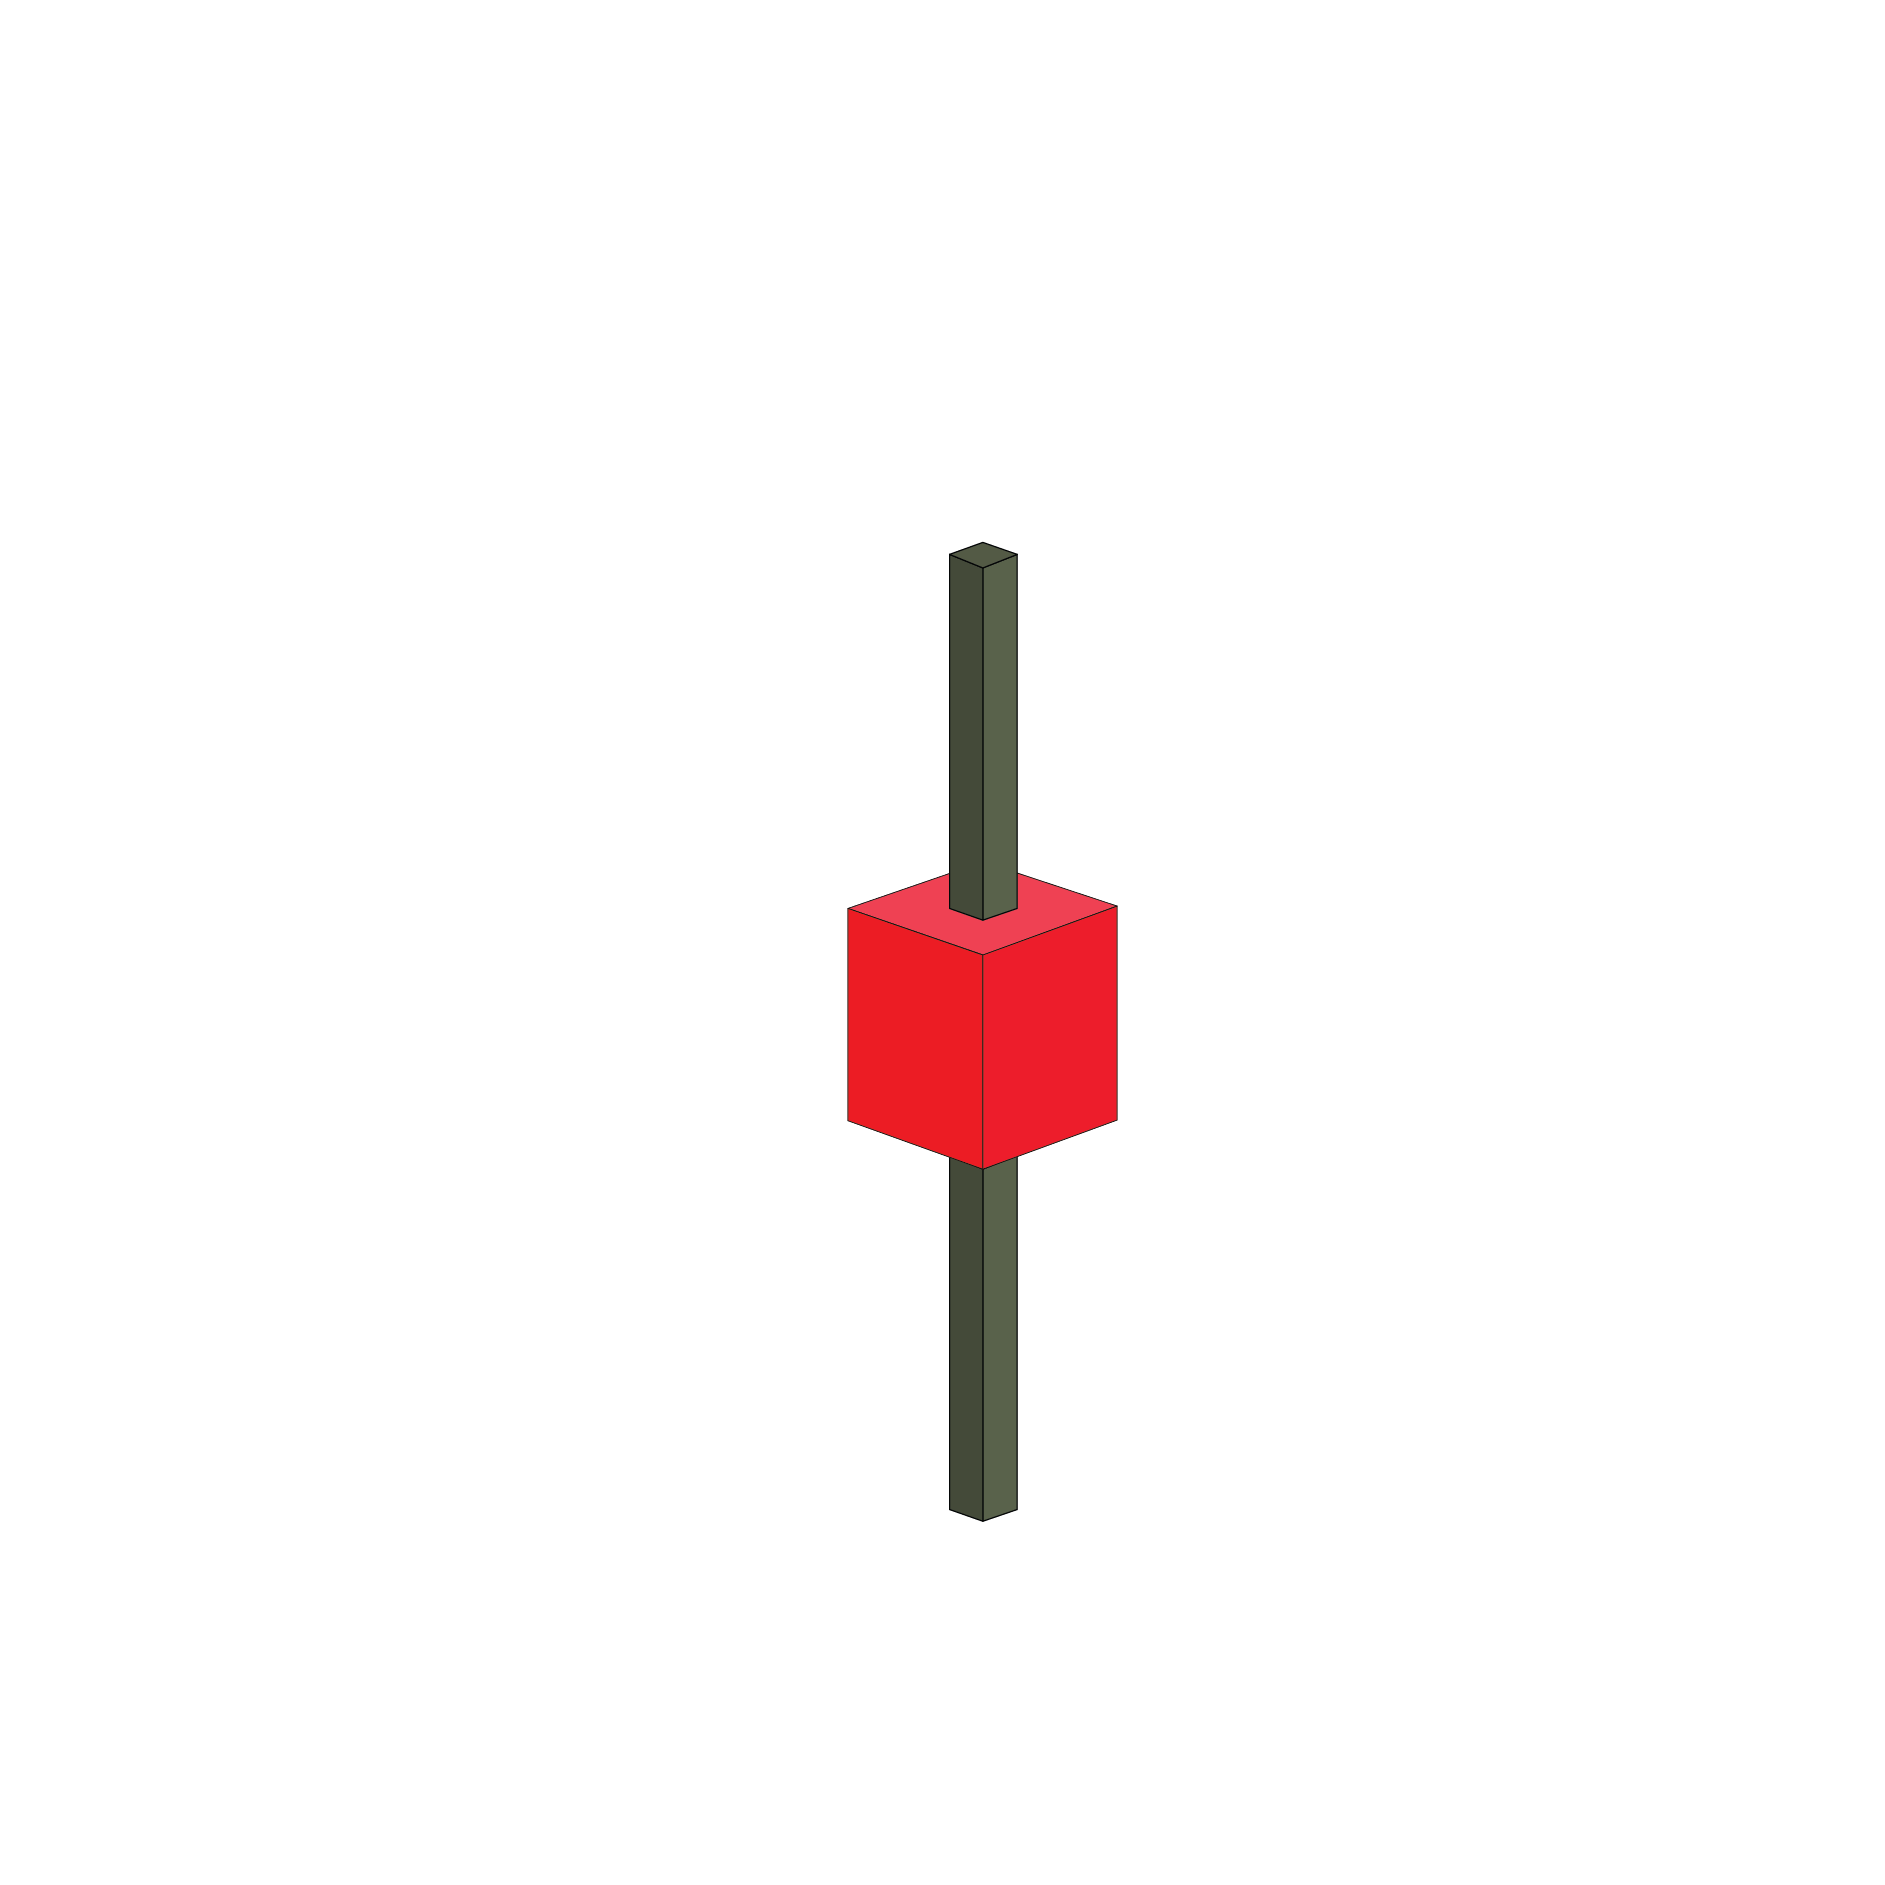
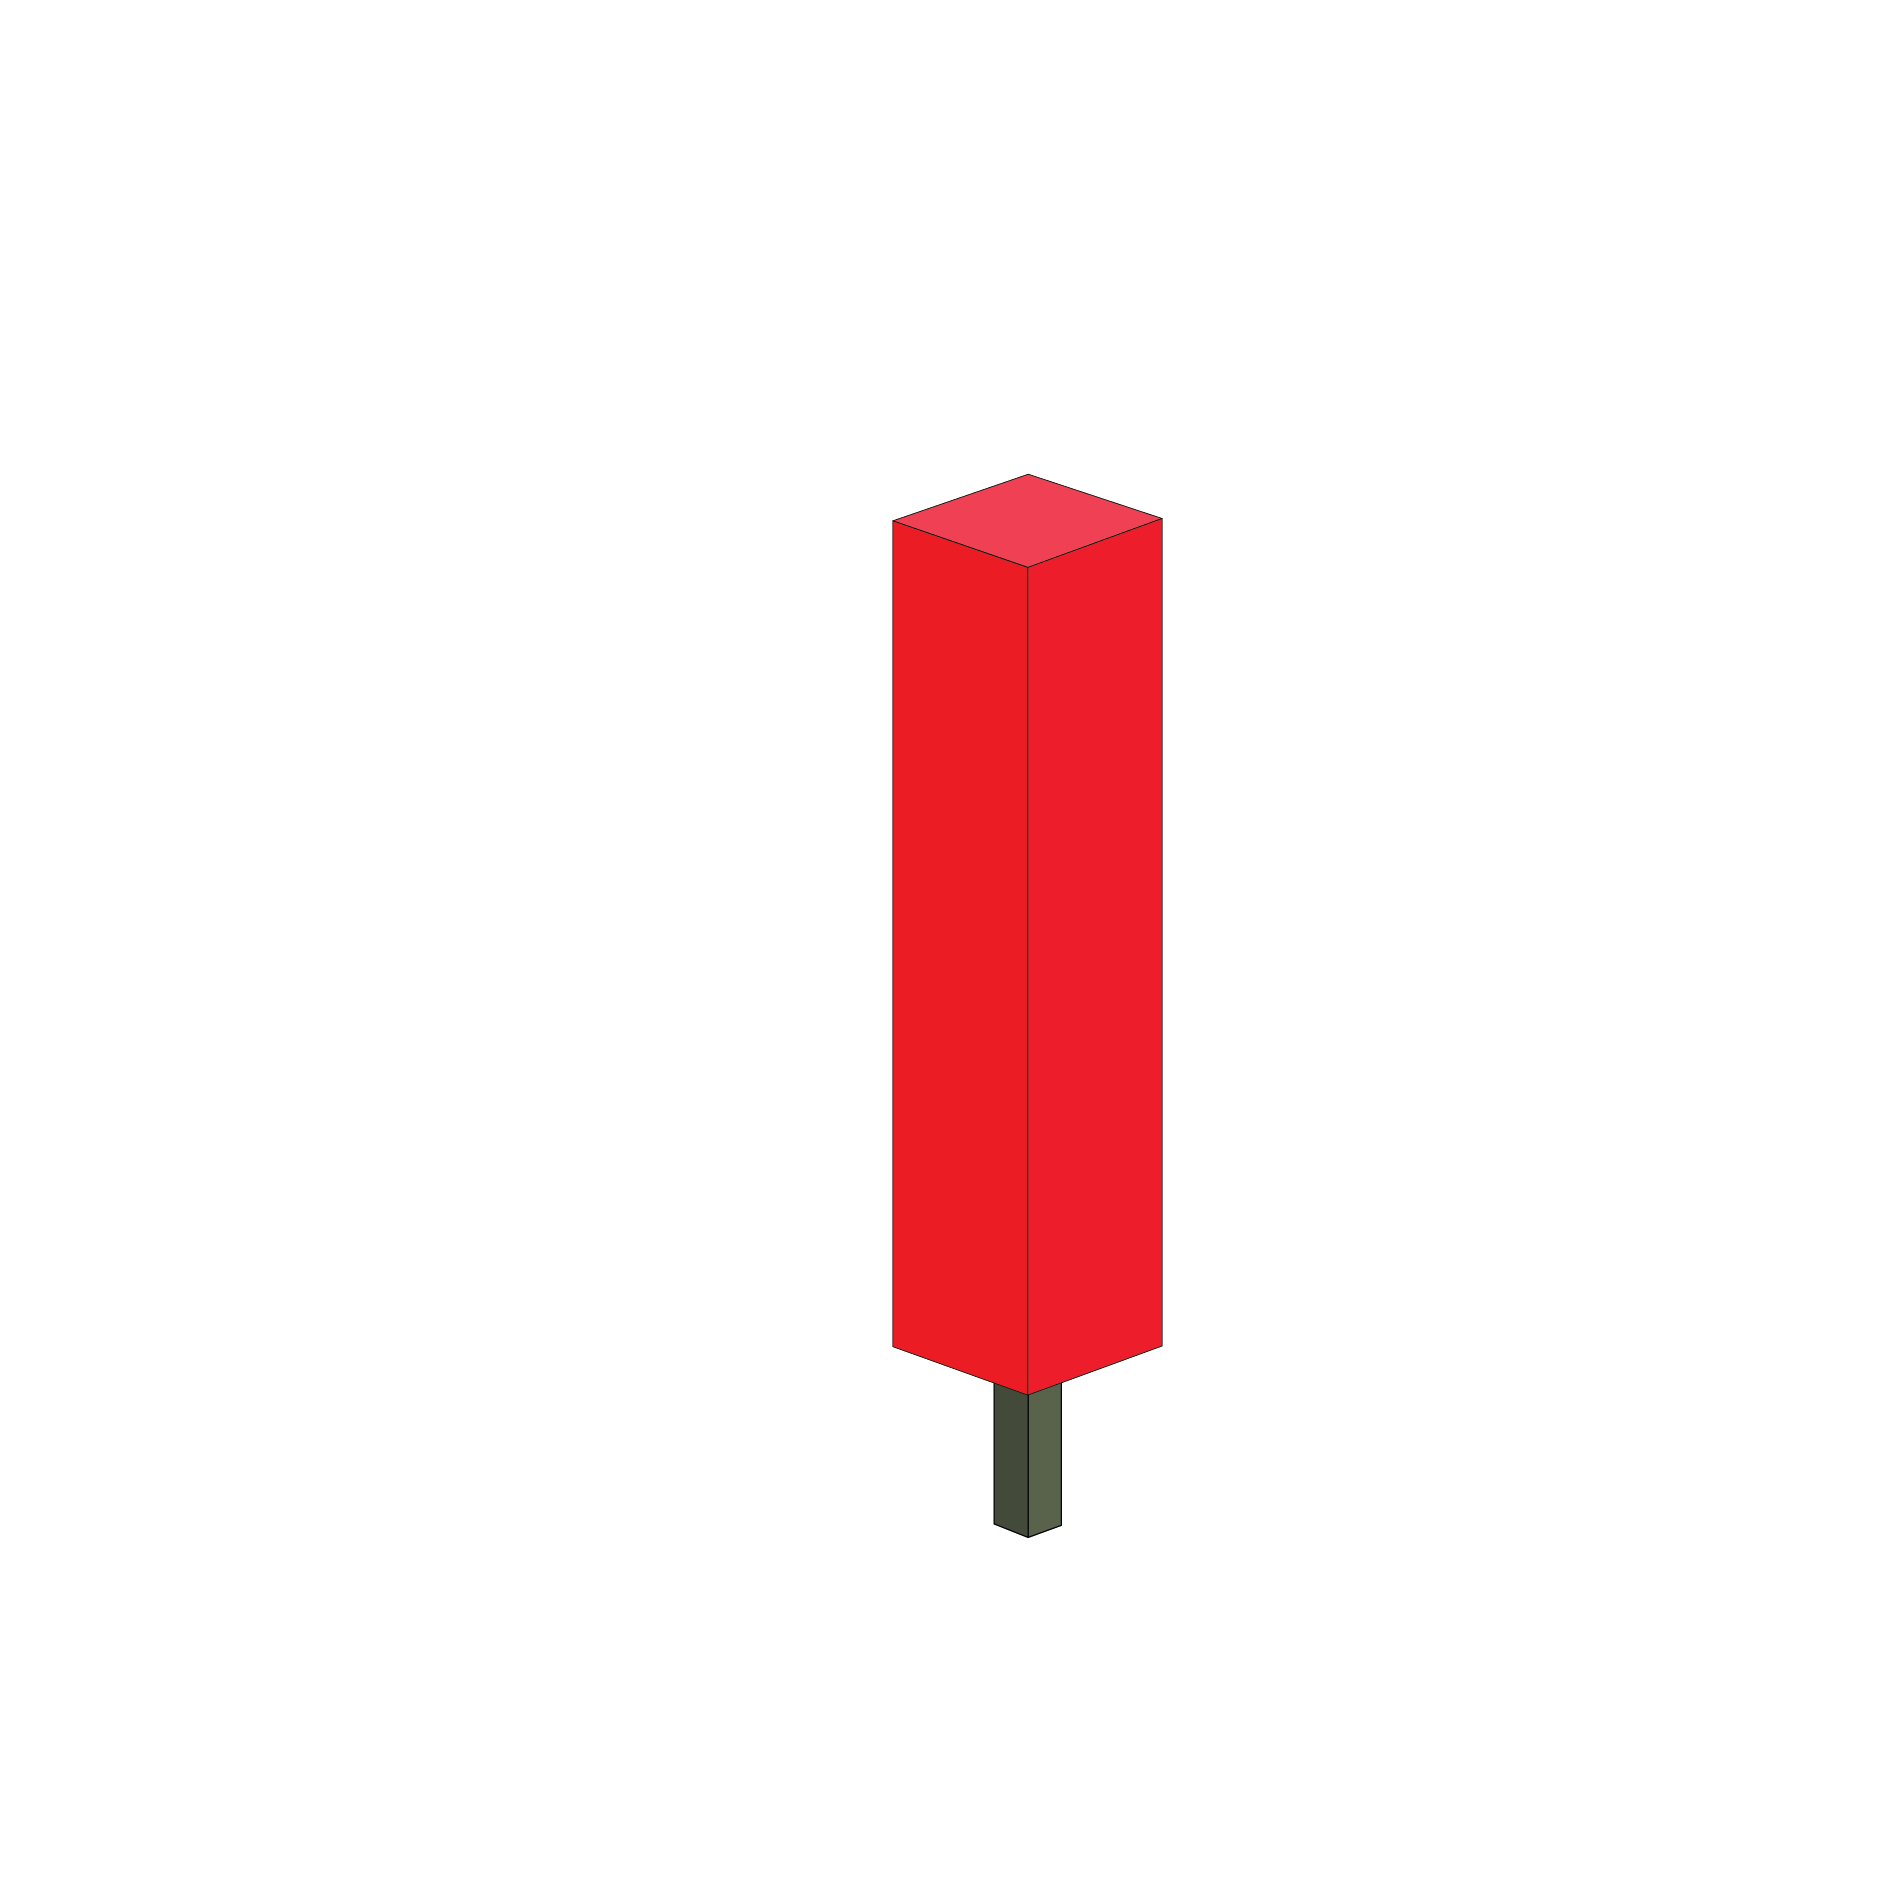
Red Opening Marubozu
This candlestick represents extreme bearishness and it is characterized with a long red body that has a lower shadow but no upper shadow.
Green Closing Marubozu
This candlestick represents extreme bullishness and it is characterized with a long green body that has a lower shadow but no upper shadow.
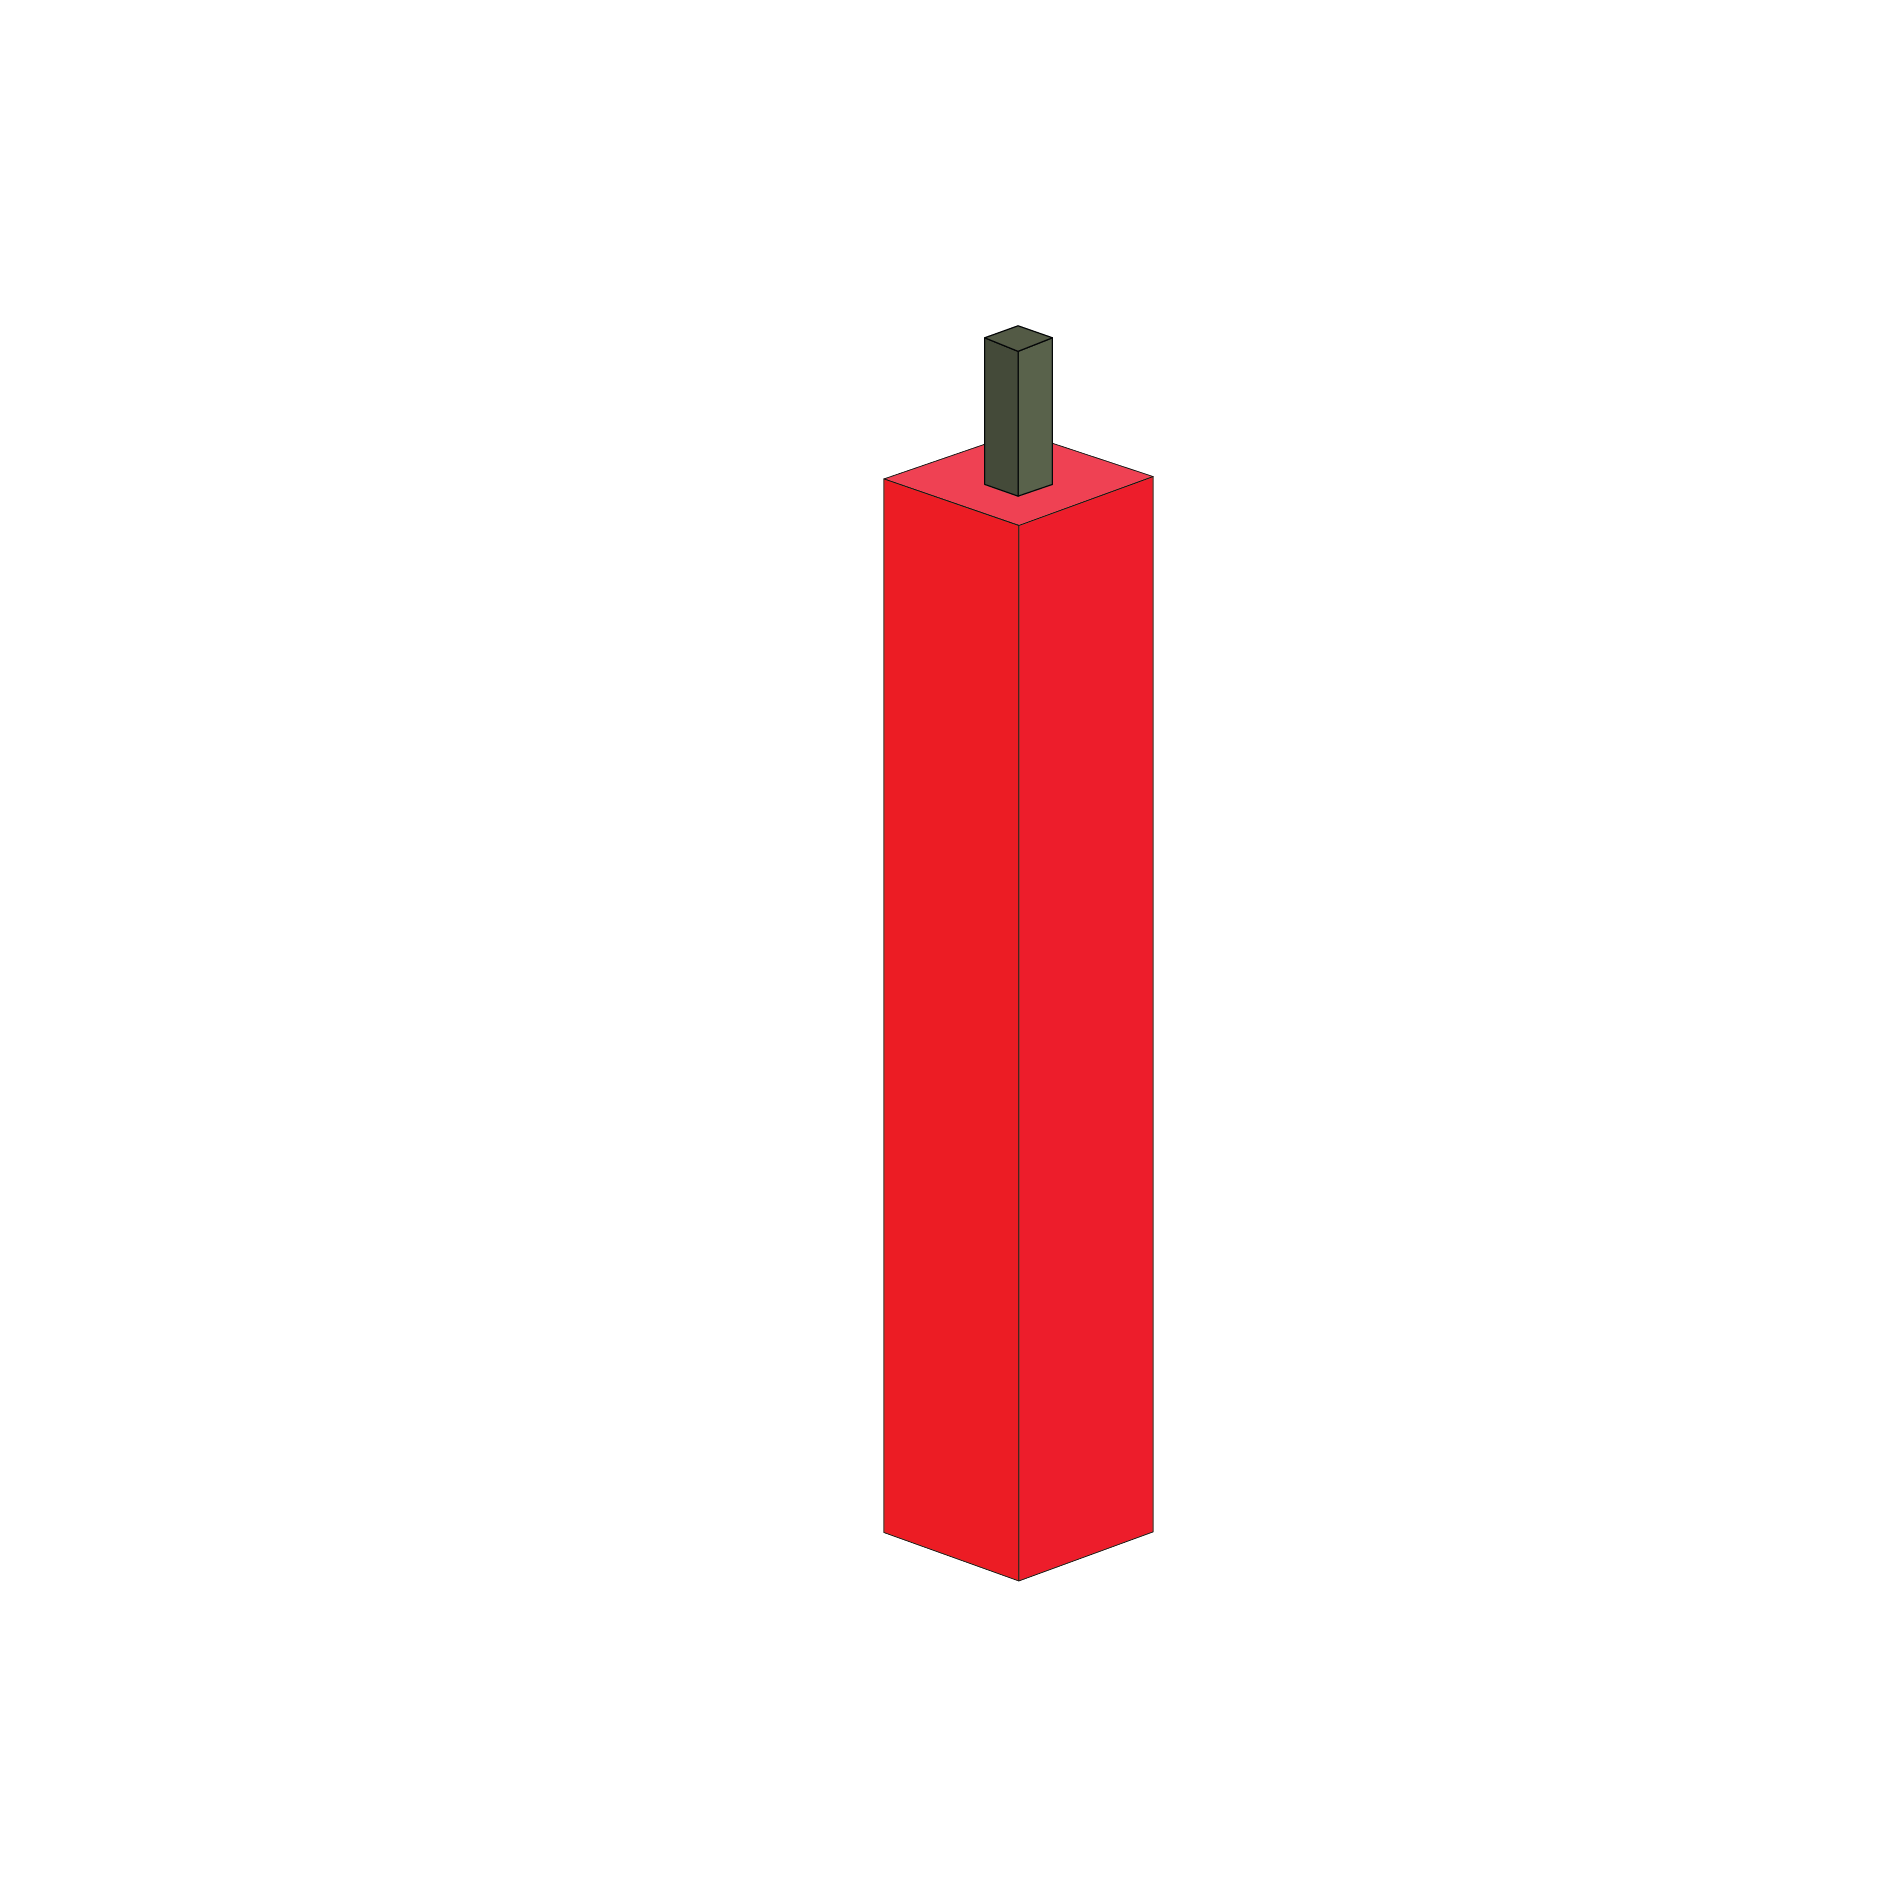
Red Closing Marubozu
This candlestick represents extreme bearishness and it is characterized with a long red body that has an upper shadow but no lower shadow.

Green Marubozu
This candlestick represents extreme bullishness and is characterized by a long green body having no shadows on either end.
Red Marubozu
This candlestick represents extreme bearishness and is characterized by a long red body having no shadows on either end.


Doji
This candlestick is formed when the opening and closing prices are virtually equal.
Four Price Doji
This candlestick is simply a horizontal line that has no upper and lower shadows.

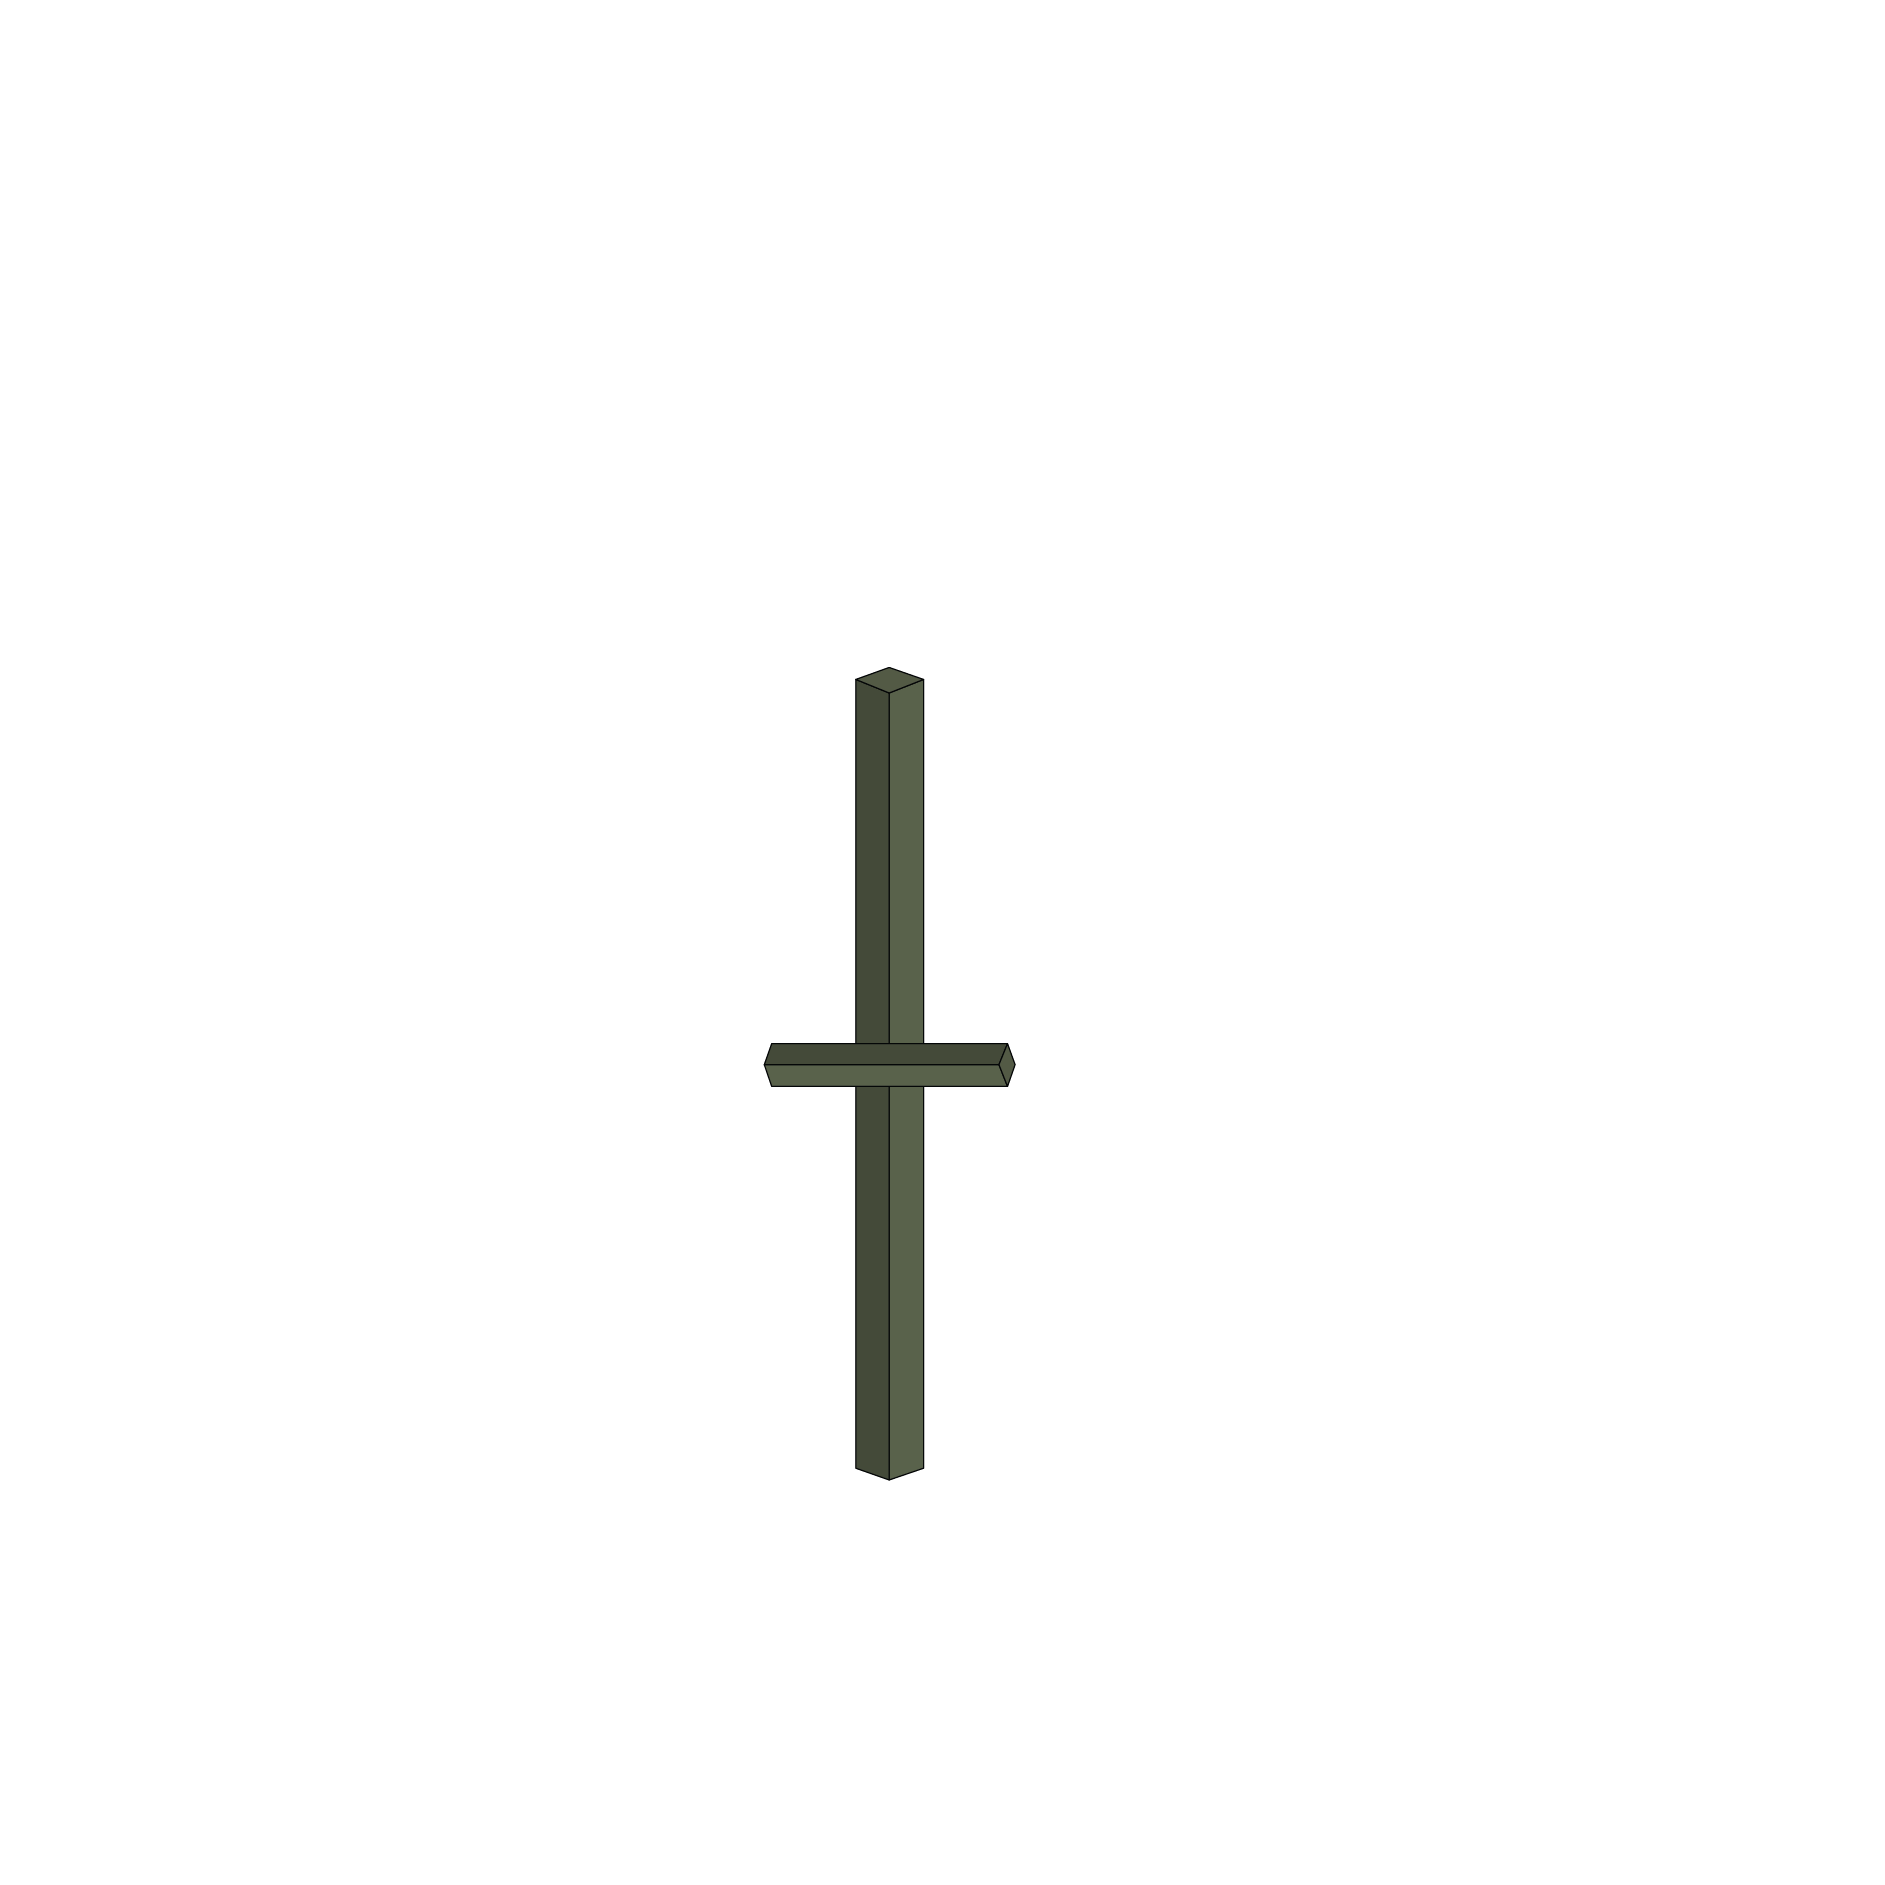
Long Legged Doji
This candlestick is a Doji with very long shadows.
Dragonfly Doji
This candlestick is a type of Doji characterized with no upper shadow but a long lower shadow.

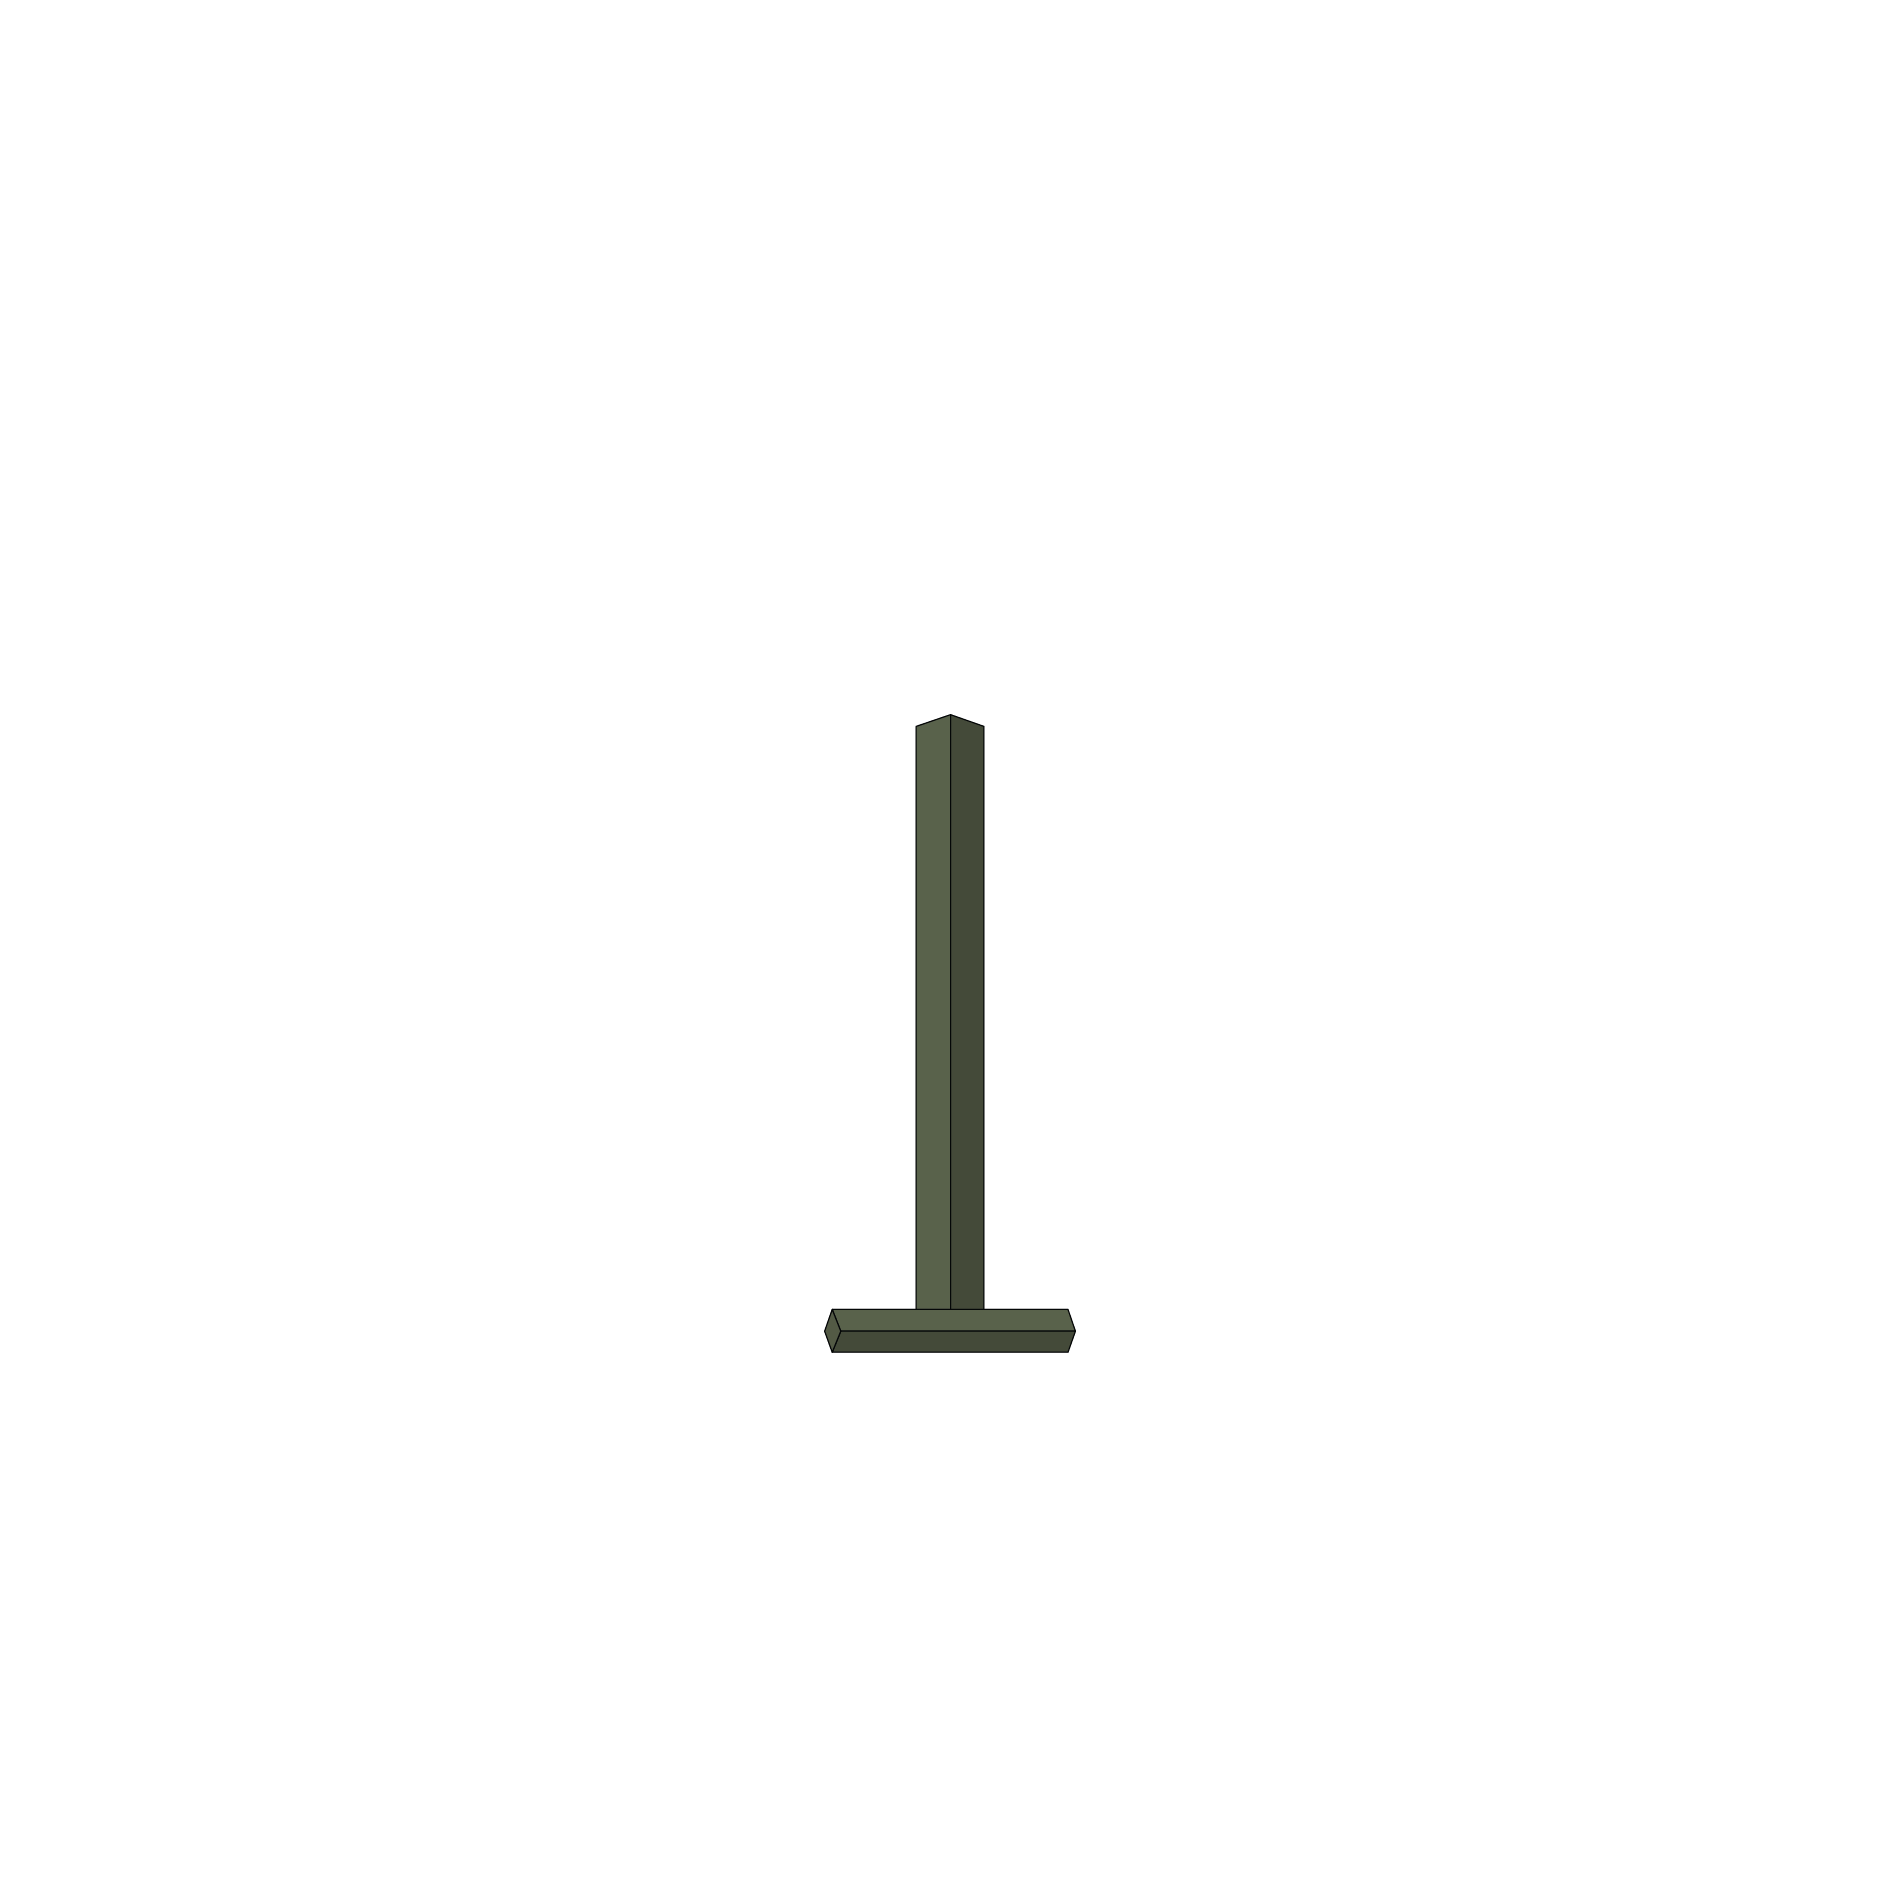
Gravestone Doji
This candlestick is a type of Doji characterized with no lower shadow but a long upper shadow.