Introduction To Candlesticks
What is a Candlestick?
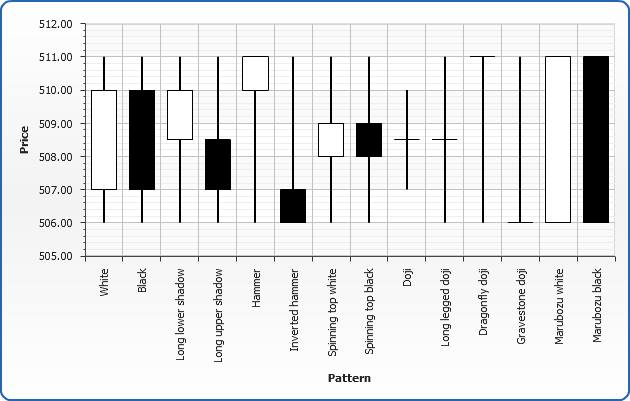
Candlesticks show the price movement in a certain period which is “a day” in this instance, by using the trading day’s open, high, low and close. A candlestick is composed of a box which is called the body, whose length is the difference between the open and close, and thin vertical lines that are called the shadows above and below the body, representing the high and low prices reached during the day. A bullish day with a closing price higher than the opening price is shown by a white (hollow) body; while a bearish day with a closing price lower than the opening is shown by a black body. The body becomes a short horizontal line when the opening and closing prices are equal. In this case the candlestick is called a Doji, which usually signifies indecision in the market.
Though single candlesticks convey valuable information about the changes in a market’s supply and demand balance, a succession of candlesticks taken together, are more pertinent for this purpose as they make a pattern. The superiority of candlestick patterns over other technical analysis tools in forecasting medium and particularly short term direction is proven. Forecasting with candlesticks requires the proper identification of more than eighty different patterns and a well behaved continuous set of data with no missing observations.
History of Candlesticks
The western world became acquainted with candlestick charting quite recently but this charting technique has been well known in Japan for a long time. Steve Nison introduced candlestick charting to the western world. According to legend, a Japanese trader Homma Munehisa developed candlestick charting to analyze the price of rice contracts in the 18th century and amassed a huge fortune using this method. Homma used Sakata’s Five Patterns, patterns derived from the rules used by local traders from his hometown of Sakata as the foundation of candlestick charting. Nison, however, argues that candlestick charting first appeared sometime after 1850. It is quite possible that Homma initiated this kind of charting in a crude form and his original ideas were later modified and refined over many years of trading eventually evolving to its current form by the late 19th.
Common Types of Candlesticks
Candlesticks are classified according to the length of the body, the existence or non-existence of shadows and the length of shadows. The body lengths, which show the strength of the daily price movement, are classified as short, normal and long. The candlesticks characterized by small bodies (spinning tops) or absence of bodies (Doji) signify market indecision. When the day’s open, high, low and close are all equal, a Four Price Doji without any body and shadows emerge which most of the time is caused by data errors, or non-traded days. Long black or white (hollow) bodies lacking upper shadows, lower shadows or both are called Marubozu. The body color represents that either the buyers are in control of the market (if white or hollow) or the sellers (if black).
The patterns which are a group of candlesticks interpreted together are formed by two, three, four or five successive candlesticks, the most common of which are two-day patterns. The four or five day patterns are very rare. Most of the patterns are symmetric in nature with bullish patterns having their bearish counterparts similar in shape but different in body color and relative location. However, a few of the patterns do not obey this symmetry.

Use of Candlesticks
Single candlesticks give valuable information about the psychology and underlying price dynamics of the market, especially when they are interpreted in the light of all the possible news and fundamental facts about a security. Candlesticks observed at significant support and resistance levels particularly deserve serious consideration as bullish or bearish reversal signals. However, due attention to the direction of the prior trend is always warranted.
Experienced technical traders prefer to rely more on patterns of two or more successive candlesticks rather than single candlesticks in assessing the likelihood of a reversal. Successful trading also requires waiting for the confirmation of a pattern before an act of buying or selling, even in cases in which the patterns have a high success ratio of reversal prediction. This patience is required because sometimes a pattern can emerge as a result of a very short trend or a horizontal move and it may never be confirmed. In such cases of non-confirmation, it is better to wait in order to avoid a losing trade and until the emergence of a new pattern (if the stop loss was not triggered during this period).