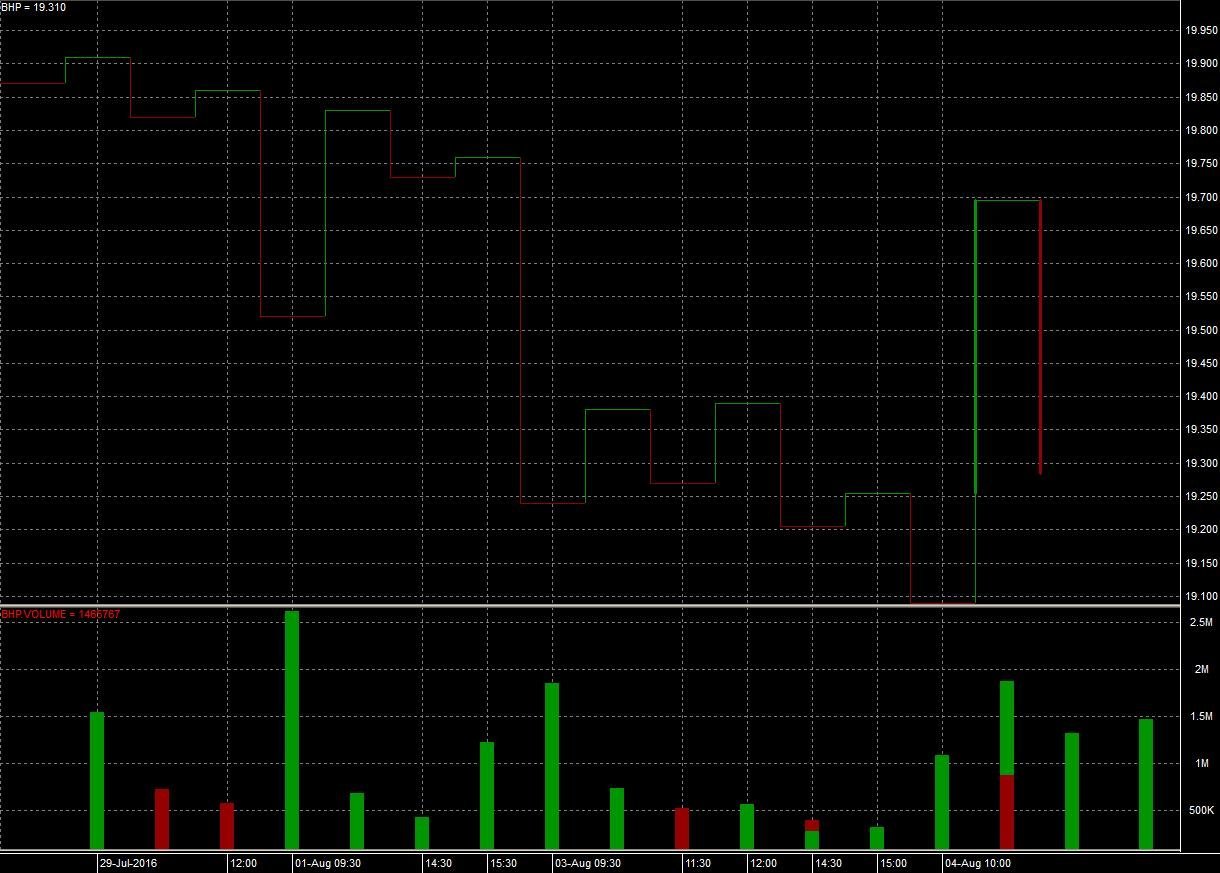
Kagi Charts
A type of chart developed by the Japanese in the 1870s that uses a series of vertical lines to illustrate general levels of supply and demand for certain assets.
Thick lines are drawn when the price of the underlying asset breaks above the previous high price and is interpreted as an increase in demand for the asset.
Thin lines are used to represent increased supply when the price falls below the previous low.
